Solved

What’s the difference between the 2 histogram bins columns in the Klaviyo CLV Calculations Template?

  • 28 August 2022
  • 1 reply
  • 92 views

Badge +2
  • Contributor I
  • 0 replies

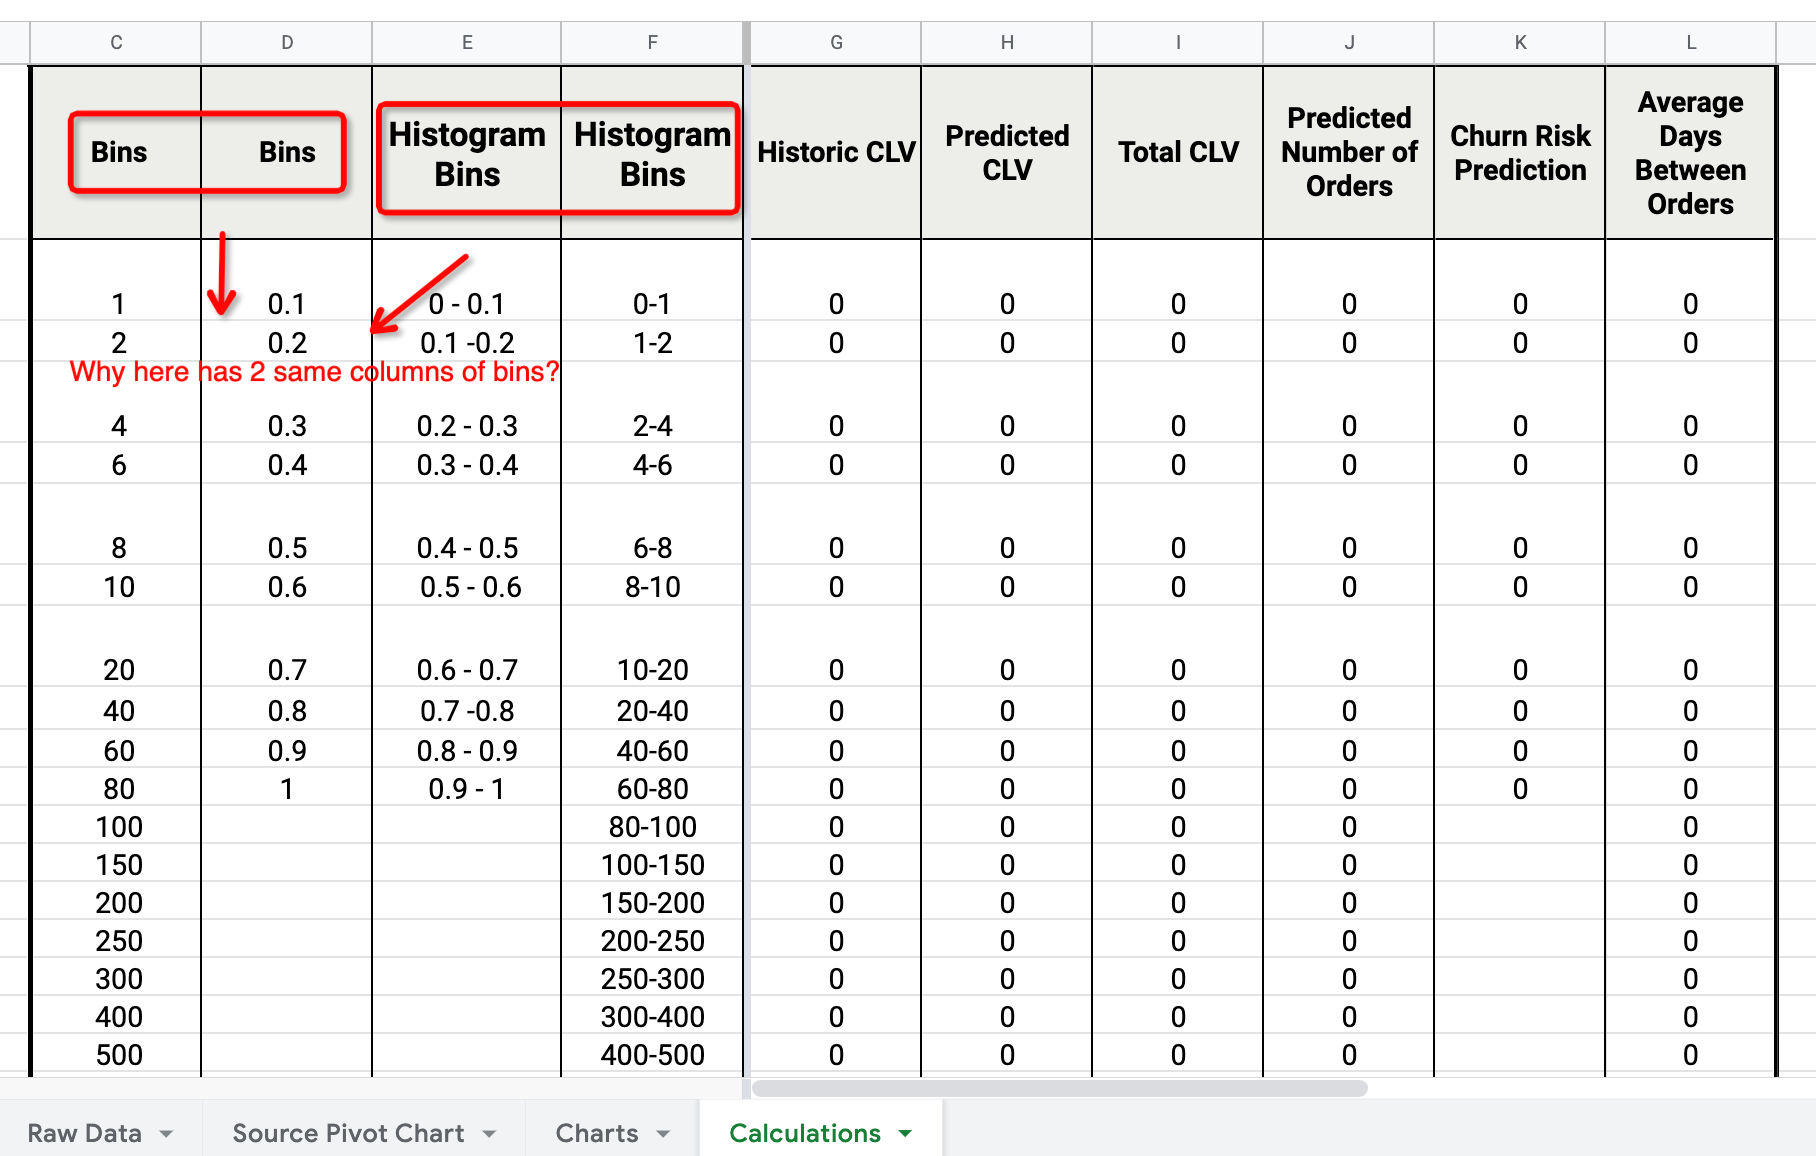
What’s the difference between the 2 histogram bins columns here? Which one I should refer to when I using the template? The video doesn’t explain the calculation sheet clearly. 

I need more clearly explanations on the metrics of the templates. Anybody could help?


icon

Best answer by Taylor Tarpley 29 August 2022, 16:15

View original

1 reply

Userlevel 7
Badge +60

Hi @Kaye,


Thanks for sharing your question about the Customer Lifetime Value Data Academy Course!


The “Bin” columns are used for calculations for generating the charts. The first "Histogram Bins" column is used to define the bins for the histogram charts for churn risk prediction. Since churn risk can be anywhere from 0 to 1, we group customers together that are from 0-0.1, 0.1-0.2, and so on up to 1 to give a total of 10 buckets that we use in our charts. 
 
The second "Bins" column corresponds to the ends of these buckets and is used for some of the sheet's calculations. Similarly, the second "Histogram Bins" column is used for all of the other variables that have larger ranges. For all of the other variables, we're saying we're going to group together customers with values of 0-1, 1-2, 2-4, etc. in the charts. The first "Bins" column corresponds to the ends of these buckets. I can definitely understand how this is a little bit tricky because the "Bins" columns are in a different order than the "Histogram Bins" columns! 

If you look at the x-axis on the charts, you'll see the values in those columns correspond to the labels. The churn risk chart has the bins that increase by 0.1, while all the others use the bins with the larger range.


Finally, we had someone who recently asked another question about the same course, I’d recommend checking it out to gain more insight into the course! 


Hope this helps! 

-Taylor 

Reply