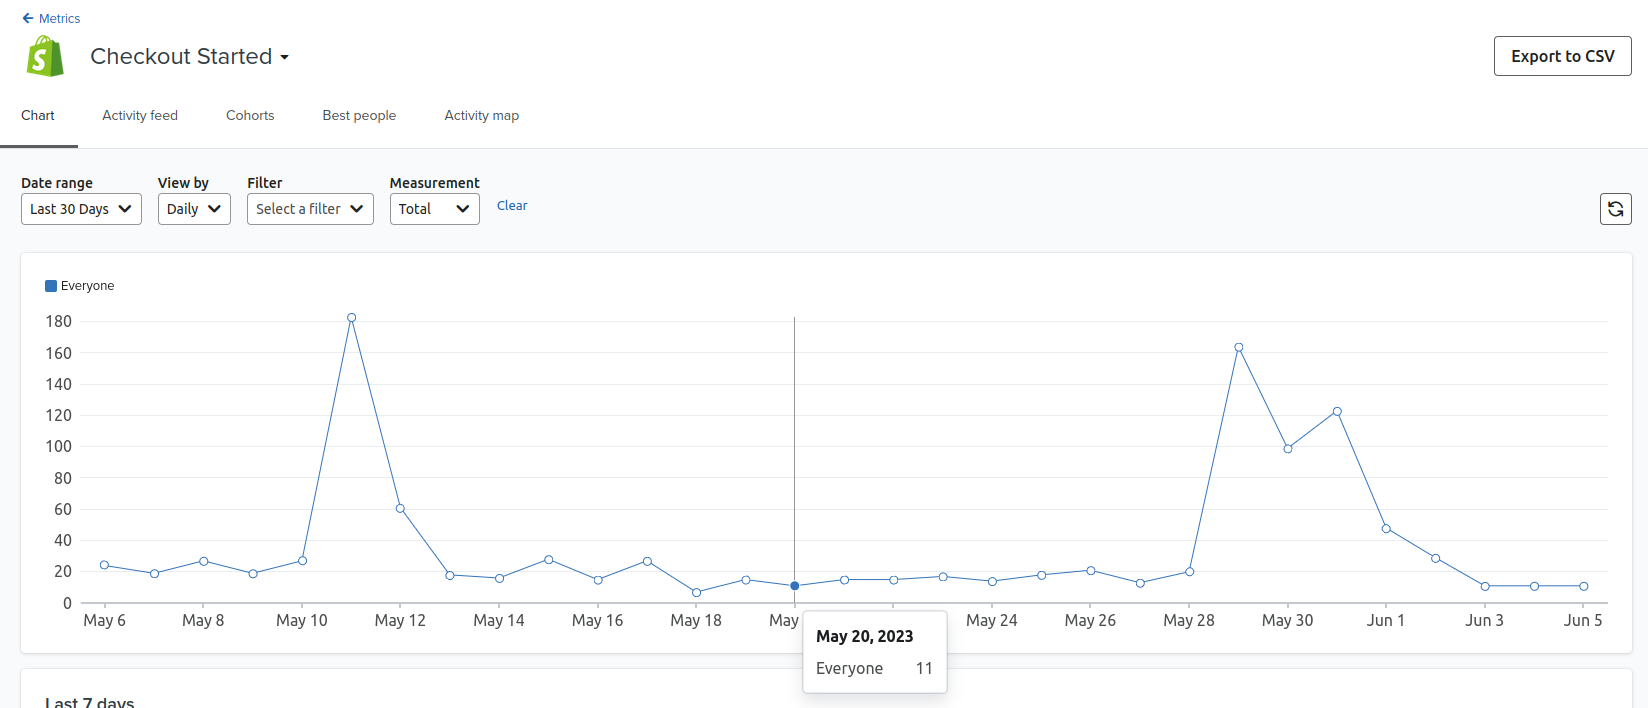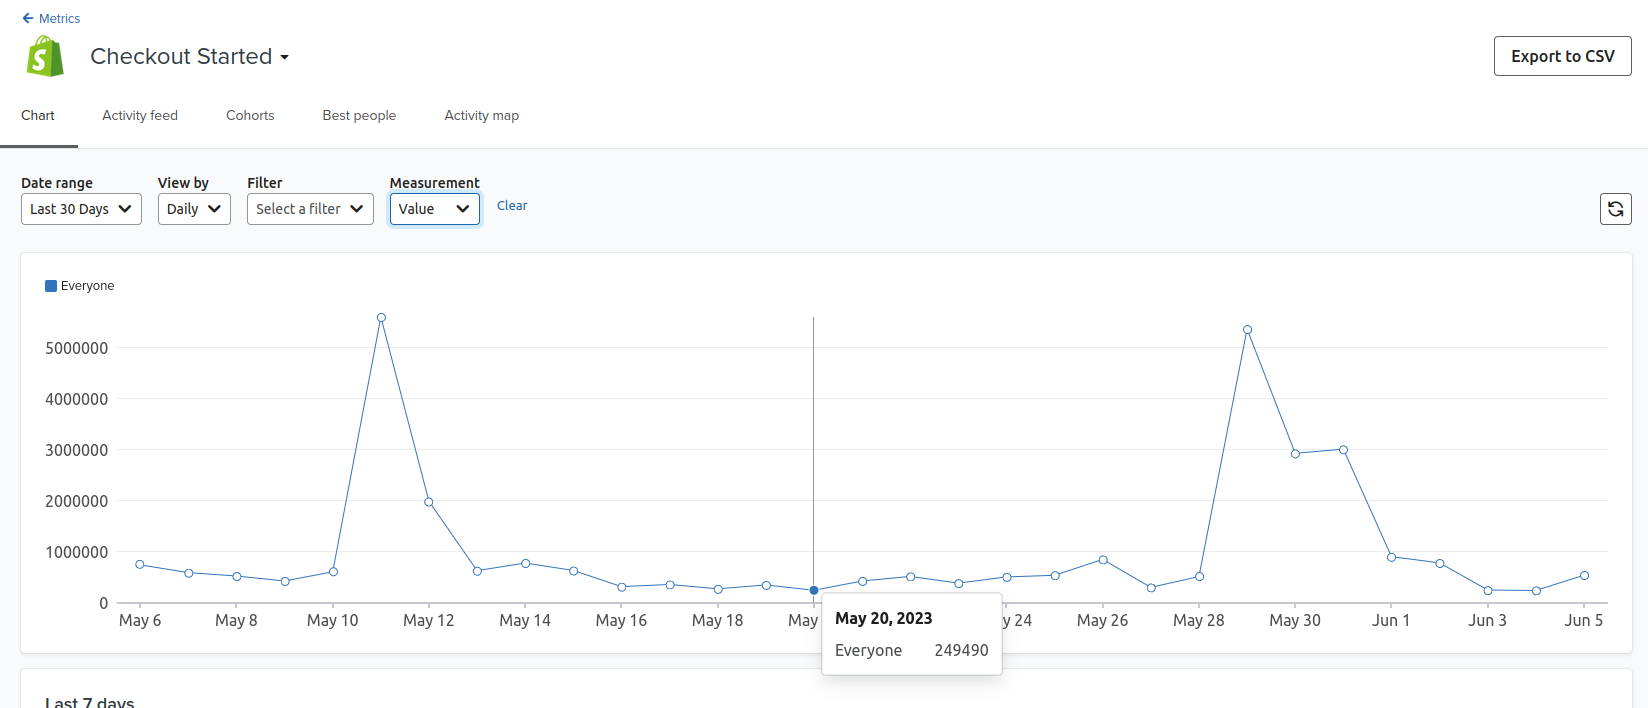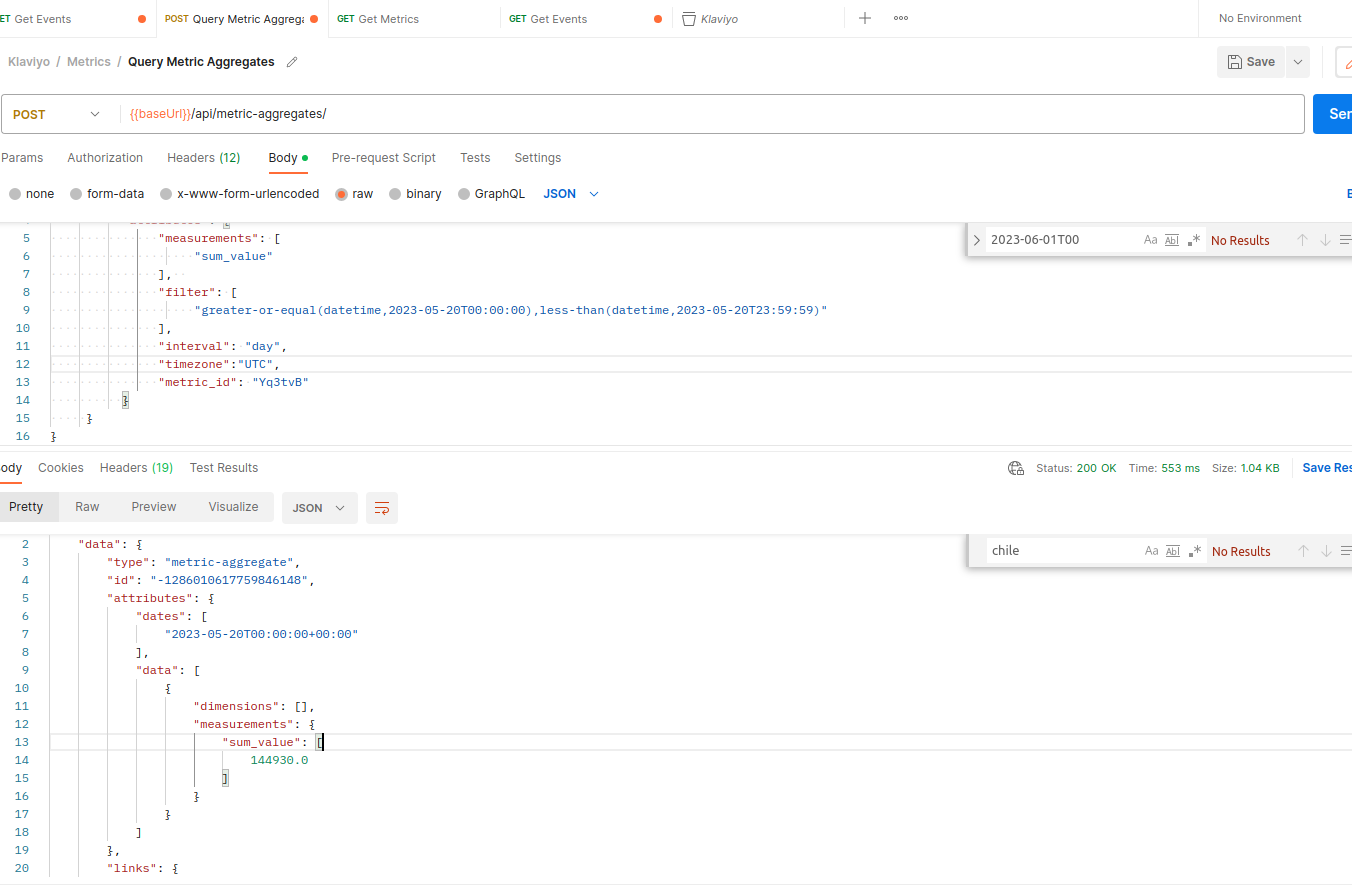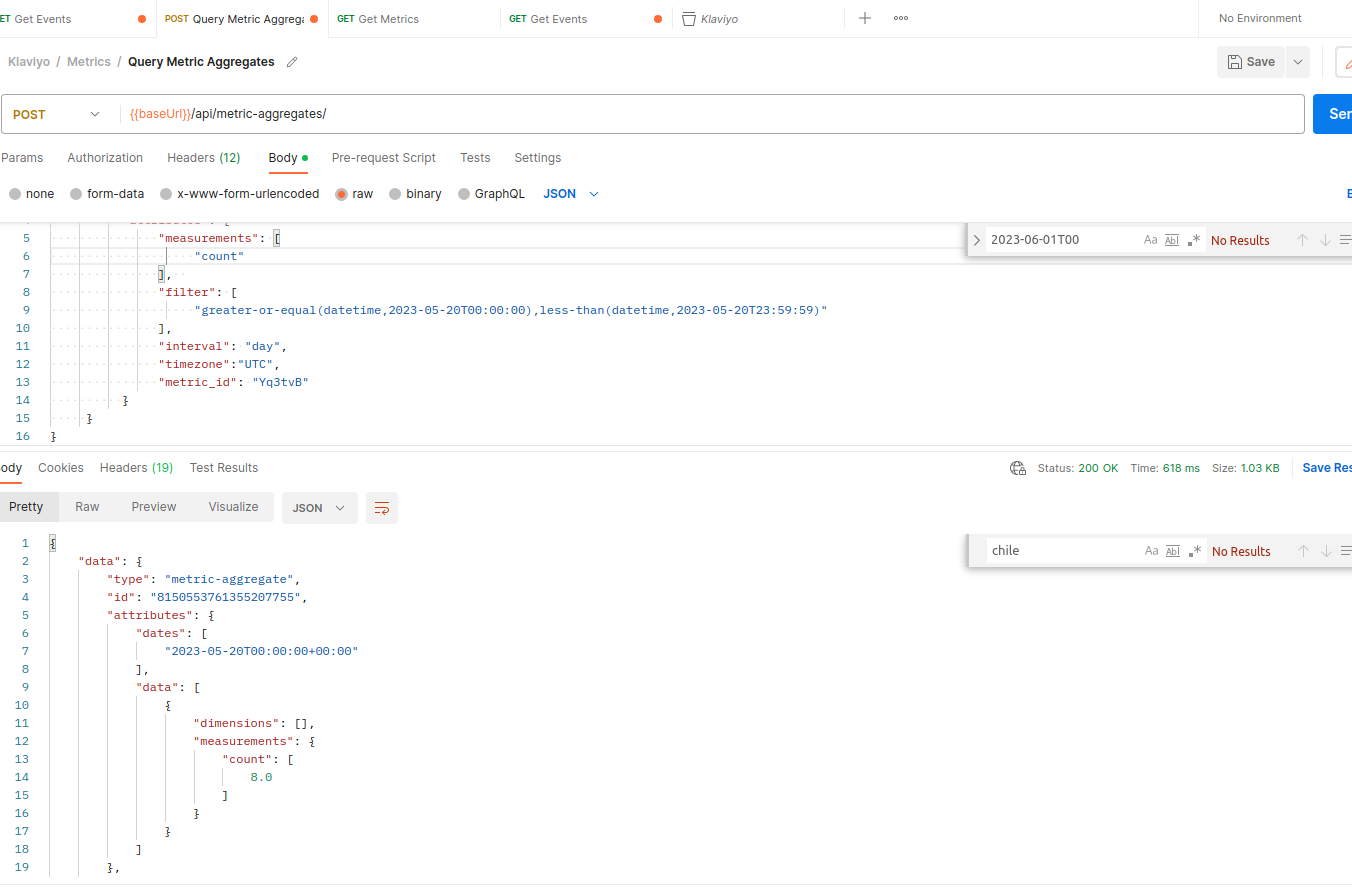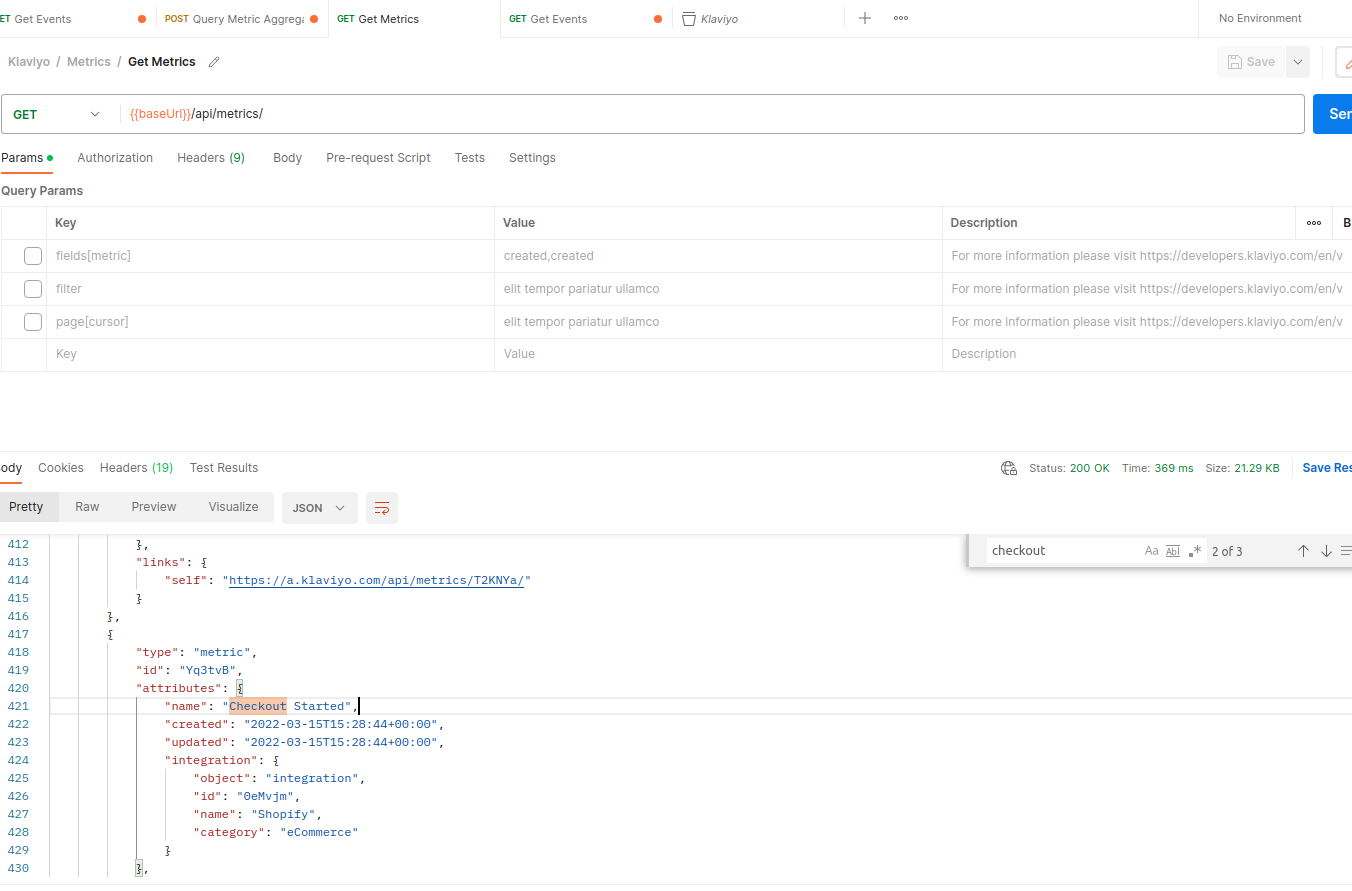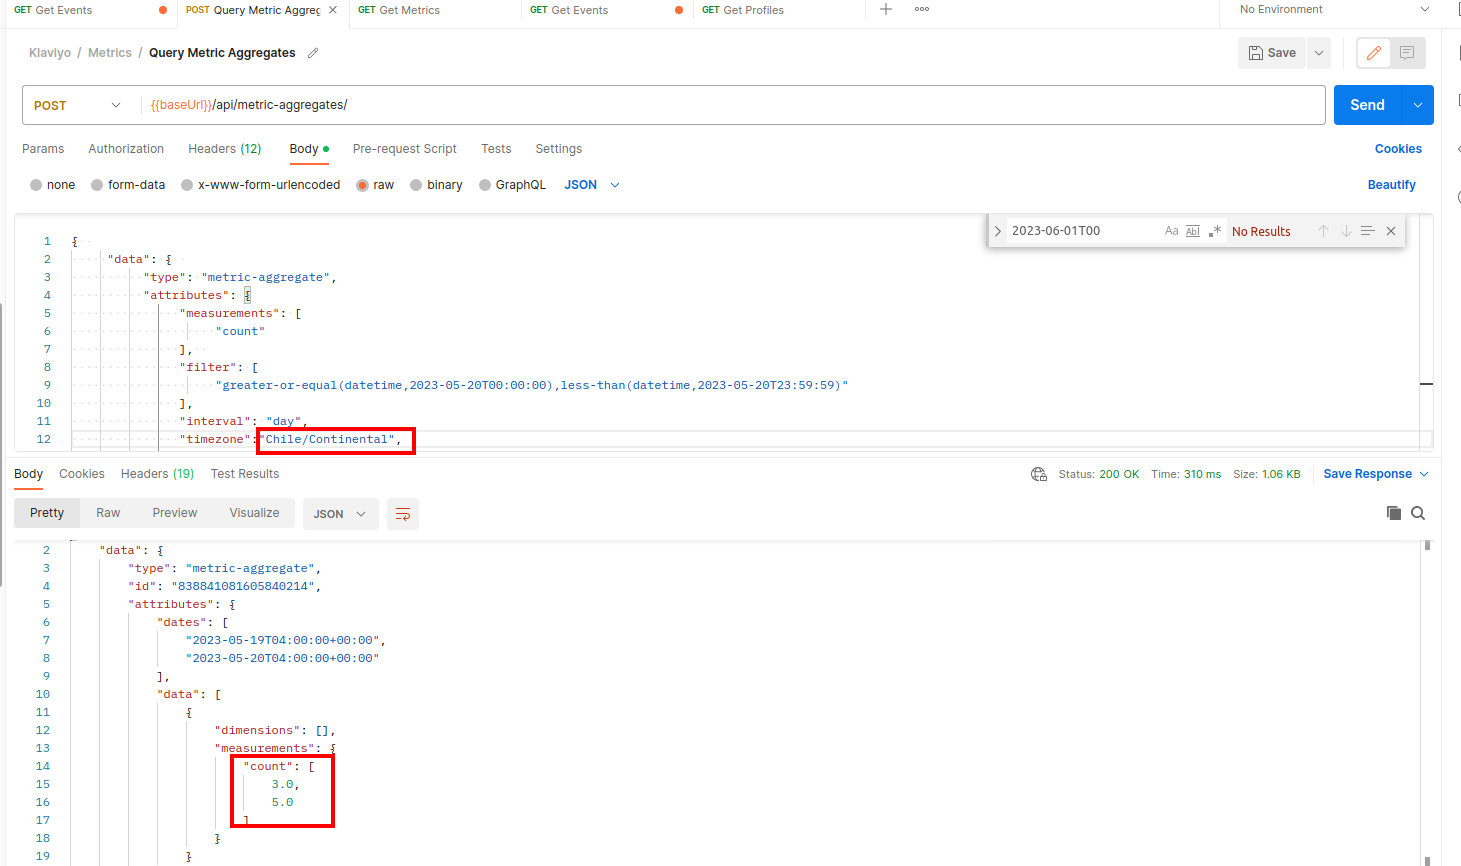


I have encountered a notable discrepancy between the data obtained from the metric-aggregates endpoint of the API and the corresponding metrics displayed in the dashboard. Specifically, I requested all the events for the metric "Checkout started" for the Shopify integration. In this example: May 20th, 2023.
According to the API response, the total sum of "Checkout started" events for that day is 144,930. However, when I view the same metric in the dashboard, it shows a significantly higher value of 249,490. Furthermore, the dashboard indicates a total count of 11, while the API only provides a total count of 8 for the same period.
I'm concerned that this discrepancy may not be limited to the "Checkout started" metric alone. It's possible that similar inconsistencies could exist between other metrics obtained from the API and their corresponding representations in the dashboard.
I would appreciate any insights or guidance from the community regarding potential reasons for this discrepancy. Has anyone else encountered a similar inconsistency between API data and dashboard metrics? Are there any known factors or potential sources of error that could explain this difference? Any suggestions for troubleshooting or further investigation would be highly valuable.