Solved

How to Create Dashboard Charts with Trends


Forum|alt.badge.img+6

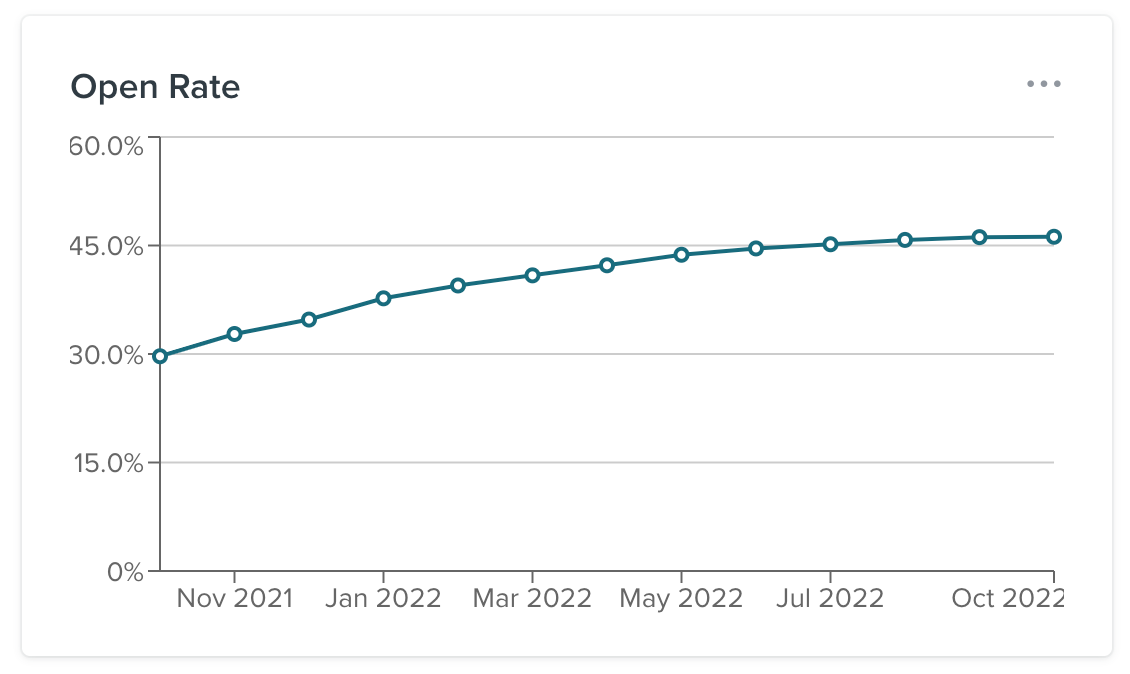
Hi, the previous dashboard had a way of creating a monthly, weekly, daily, yearly, trend chart for click-rates, open, rates, bounce rates, and spam rates for each individual flow, a flows aggregate, individual campaigns, and a campaign’s aggrigate.

I can’t find a way to create this type of chart.


Please help. This is having a big impact on my ability to create reports with trends. Thanks!

Best answer by stephen.trumble

Hey @Andrew.Walters 

Thanks for asking about your dashboard reports. The Analytics section will gather ‌all data reporting tools in one place. 


VKRk2cEozfpjb-cwq7ui94pj55_yoZQRaBTV0Q3ZlrEP-ekKmjHDqyfh8IZVBbicZqlgUwevI39DxrEj61tax2QAvcH9Gtt8MCQjutVnuFKLhFbGB4r66Tra3mQHF5kqeA5sxnicYyWAUYI1gh2xS81EjZjRkeIrlqjcM37GOgNKE6L9iON2vkU6oA


By clicking on the Analytics section to expand the menu, you will see the options for:

Dashboards

Metrics

Benchmarks

Custom Reports

From here, you can navigate and use any of these Klaviyo tools as you previously did.

Also check out this other community post that covers all of the changes to the new navigation experience. 

Hope this helps!

View original
Did this topic or the replies in the thread help you find an answer to your question?

2 replies

stephen.trumble
Community Manager
Forum|alt.badge.img+60
  • Community Manager
  • 1518 replies
  • Answer
  • October 28, 2022

Hey @Andrew.Walters 

Thanks for asking about your dashboard reports. The Analytics section will gather ‌all data reporting tools in one place. 


VKRk2cEozfpjb-cwq7ui94pj55_yoZQRaBTV0Q3ZlrEP-ekKmjHDqyfh8IZVBbicZqlgUwevI39DxrEj61tax2QAvcH9Gtt8MCQjutVnuFKLhFbGB4r66Tra3mQHF5kqeA5sxnicYyWAUYI1gh2xS81EjZjRkeIrlqjcM37GOgNKE6L9iON2vkU6oA


By clicking on the Analytics section to expand the menu, you will see the options for:

Dashboards

Metrics

Benchmarks

Custom Reports

From here, you can navigate and use any of these Klaviyo tools as you previously did.

Also check out this other community post that covers all of the changes to the new navigation experience. 

Hope this helps!


Forum|alt.badge.img+6
  • Author
  • Problem Solver I
  • 30 replies
  • October 28, 2022

I feel like there’s lots of charting options in the old Analytics tab that are not available in the new Dashboard experience.


For instance,