Hello,
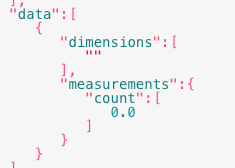
I am trying to use the Query metric aggregates endpoint to download aggregated data, but I am getting inconsistent results when using or not using the “by” parameter for partitioning. When I request aggregated data for a certain period where no values are present, the endpoint returns a JSON with individual aggregated dates, and for each, the corresponding aggregated value is 0.0. However, if I add the “by” parameter for partitioning within the same period, the endpoint returns the correct number of dates, but only one aggregated value of 0.0. I am not sure how to interpret this result, as I expected the number of aggregated values to match the number of returned dates, but in this case, it does not.
Example without “by” parametr
REQUEST
{
   "data":{
      "type":"metric-aggregate",
      "attributes":{
         "interval":"day",
         "page_size":500,
         "timezone":"UTC",
         "measurements":[
            "count"
         ],
         "filter":[
            "greater-or-equal(datetime,2024-09-22T00:00:00)",
            "less-than(datetime,2024-09-30T00:00:00)"
         ],
         "metric_id":"ShBCif",
         "by":[

         ]
      }
   }
}
RESPONSE
{
   "data":{
      "type":"metric-aggregate",
      "id":"-3097399037002004947",
      "attributes":{
         "dates":[
            "2024-09-22T00:00:00+00:00",
            "2024-09-23T00:00:00+00:00",
            "2024-09-24T00:00:00+00:00",
            "2024-09-25T00:00:00+00:00",
            "2024-09-26T00:00:00+00:00",
            "2024-09-27T00:00:00+00:00",
            "2024-09-28T00:00:00+00:00",
            "2024-09-29T00:00:00+00:00"
         ],
         "data":[
            {
               "dimensions":[

               ],
               "measurements":{
                  "count":[
                     0.0,
                     0.0,
                     0.0,
                     0.0,
                     0.0,
                     0.0,
                     0.0,
                     0.0
                  ]
               }
            }
         ]
      },
      "links":{
         "self":"<https://a.klaviyo.com/api/metric-aggregates/>"
      }
   },
   "links":{
      "self":"<https://a.klaviyo.com/api/metric-aggregates/>",
      "next":null,
      "prev":null
   }
}
Example WITH “by” parametr
REQUEST
{
   "data":{
      "type":"metric-aggregate",
      "attributes":{
         "interval":"day",
         "page_size":500,
         "timezone":"UTC",
         "measurements":[
            "count"
         ],
         "filter":[
            "greater-or-equal(datetime,2024-09-22T00:00:00)",
            "less-than(datetime,2024-09-30T00:00:00)"
         ],
         "metric_id":"ShBCif",
         "by":[
            "Campaign Name"
         ]
      }
   }
}
RESPONSE
{
   "data":{
      "type":"metric-aggregate",
      "id":"-1187976627318456868",
      "attributes":{
         "dates":[
            "2024-09-22T00:00:00+00:00",
            "2024-09-23T00:00:00+00:00",
            "2024-09-24T00:00:00+00:00",
            "2024-09-25T00:00:00+00:00",
            "2024-09-26T00:00:00+00:00",
            "2024-09-27T00:00:00+00:00",
            "2024-09-28T00:00:00+00:00",
            "2024-09-29T00:00:00+00:00"
         ],
         "data":[
            {
               "dimensions":[
                  ""
               ],
               "measurements":{
                  "count":[
                     0.0
                  ]
               }
            }
         ]
      },
      "links":{
         "self":"<https://a.klaviyo.com/api/metric-aggregates/>"
      }
   },
   "links":{
      "self":"<https://a.klaviyo.com/api/metric-aggregates/>",
      "next":null,
      "prev":null
   }
}
Thank you for help.
!-->


![[Academy] Deliverability Certificate Forum|alt.badge.img](https://uploads-us-west-2.insided.com/klaviyo-en/attachment/505f2253-cde5-4365-98fd-9d894328b3e0_thumb.png)
