So I noticed that there’s a way to export AB test results via the flow analytics, but is there a way to export these results if you’re using custom reports?
Hello
Just like how you can export flow emails running an A/B test through the flow analytics, you can absolutely do the same through custom reports!
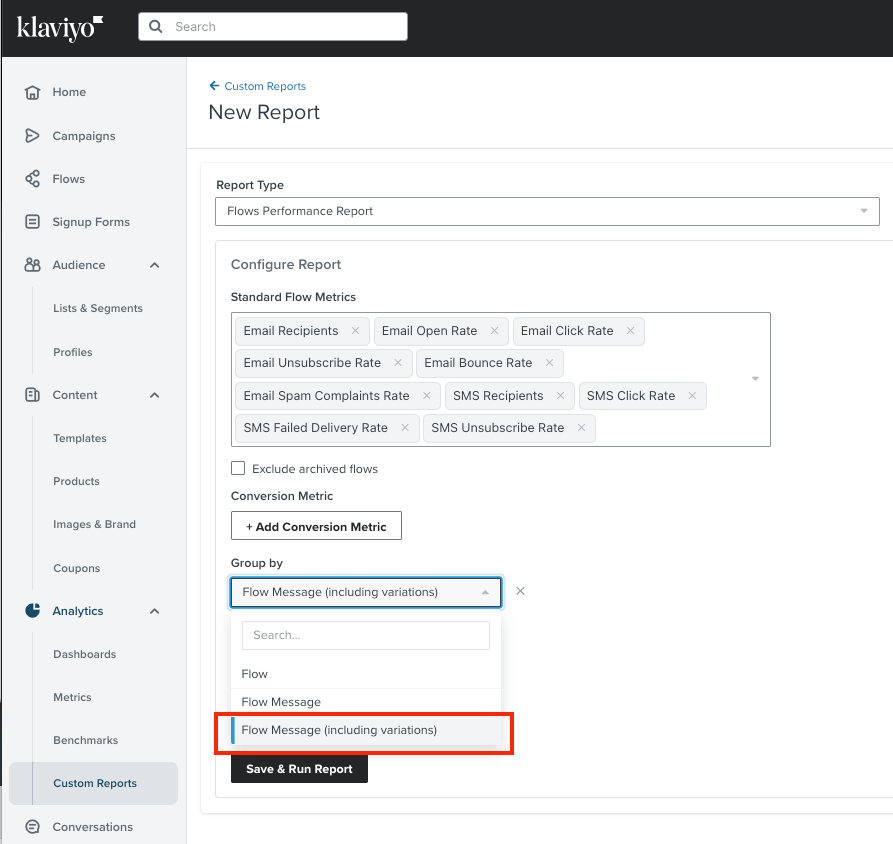
In case you missed it, you can use the Flow Performance Report. Clicking into the Group by option will give you the option for Flow Message (including variations).

This way, instead of simply aggregating the flow message’s performance, you’ll see the different variations and their respective performance.
I hope this helps!
David
Ah yep, I’ve missed that - thanks
The report that you have shared only provides a summarised view of the flow emails. I want to perform more analysis than what Klaviyo can provide, so I need the individual customer data for everyone included in an A/B test. Is this possible?
Hey
If you’re looking for more analytics than what Klaviyo can provider, I would suggest using third-party tools for more in depth analysis. We actually have a number of Tech Partners that offer a direct integration with Klaviyo that makes sharing this data to those platforms easier.
Else, you could also leverage our various API endpoints to accomplish something similar. You can find a list of some of our most commonly used export endpoints from our Export data from Klaviyo Developer Guide.
Alternatively, if you were just looking for top-level data pertaining to recipients such as which who received which email, who opened or clicked an email, etc, you can do so through two methods:
- You can either create a segment with your desired definitions and export it
- Export the various recipient activity reports right in the flow analytics
David
Hello
Just like how you can export flow emails running an A/B test through the flow analytics, you can absolutely do the same through custom reports!
In case you missed it, you can use the Flow Performance Report. Clicking into the Group by option will give you the option for Flow Message (including variations).

This way, instead of simply aggregating the flow message’s performance, you’ll see the different variations and their respective performance.
I hope this helps!
David
Hello David, thanks for explaining it with the Flow Performance Report. May I ask is there a way to do it with Campaign Performance Report? I am sending a campaign with same A/B testing to different segments by location, I need to caculate the average open rate and click through rate for those campaigns. Thank you.
Hey
You can absolutely view your campaign A/B test just like you can with a flow perfomrnace report by using a campaign performance report.
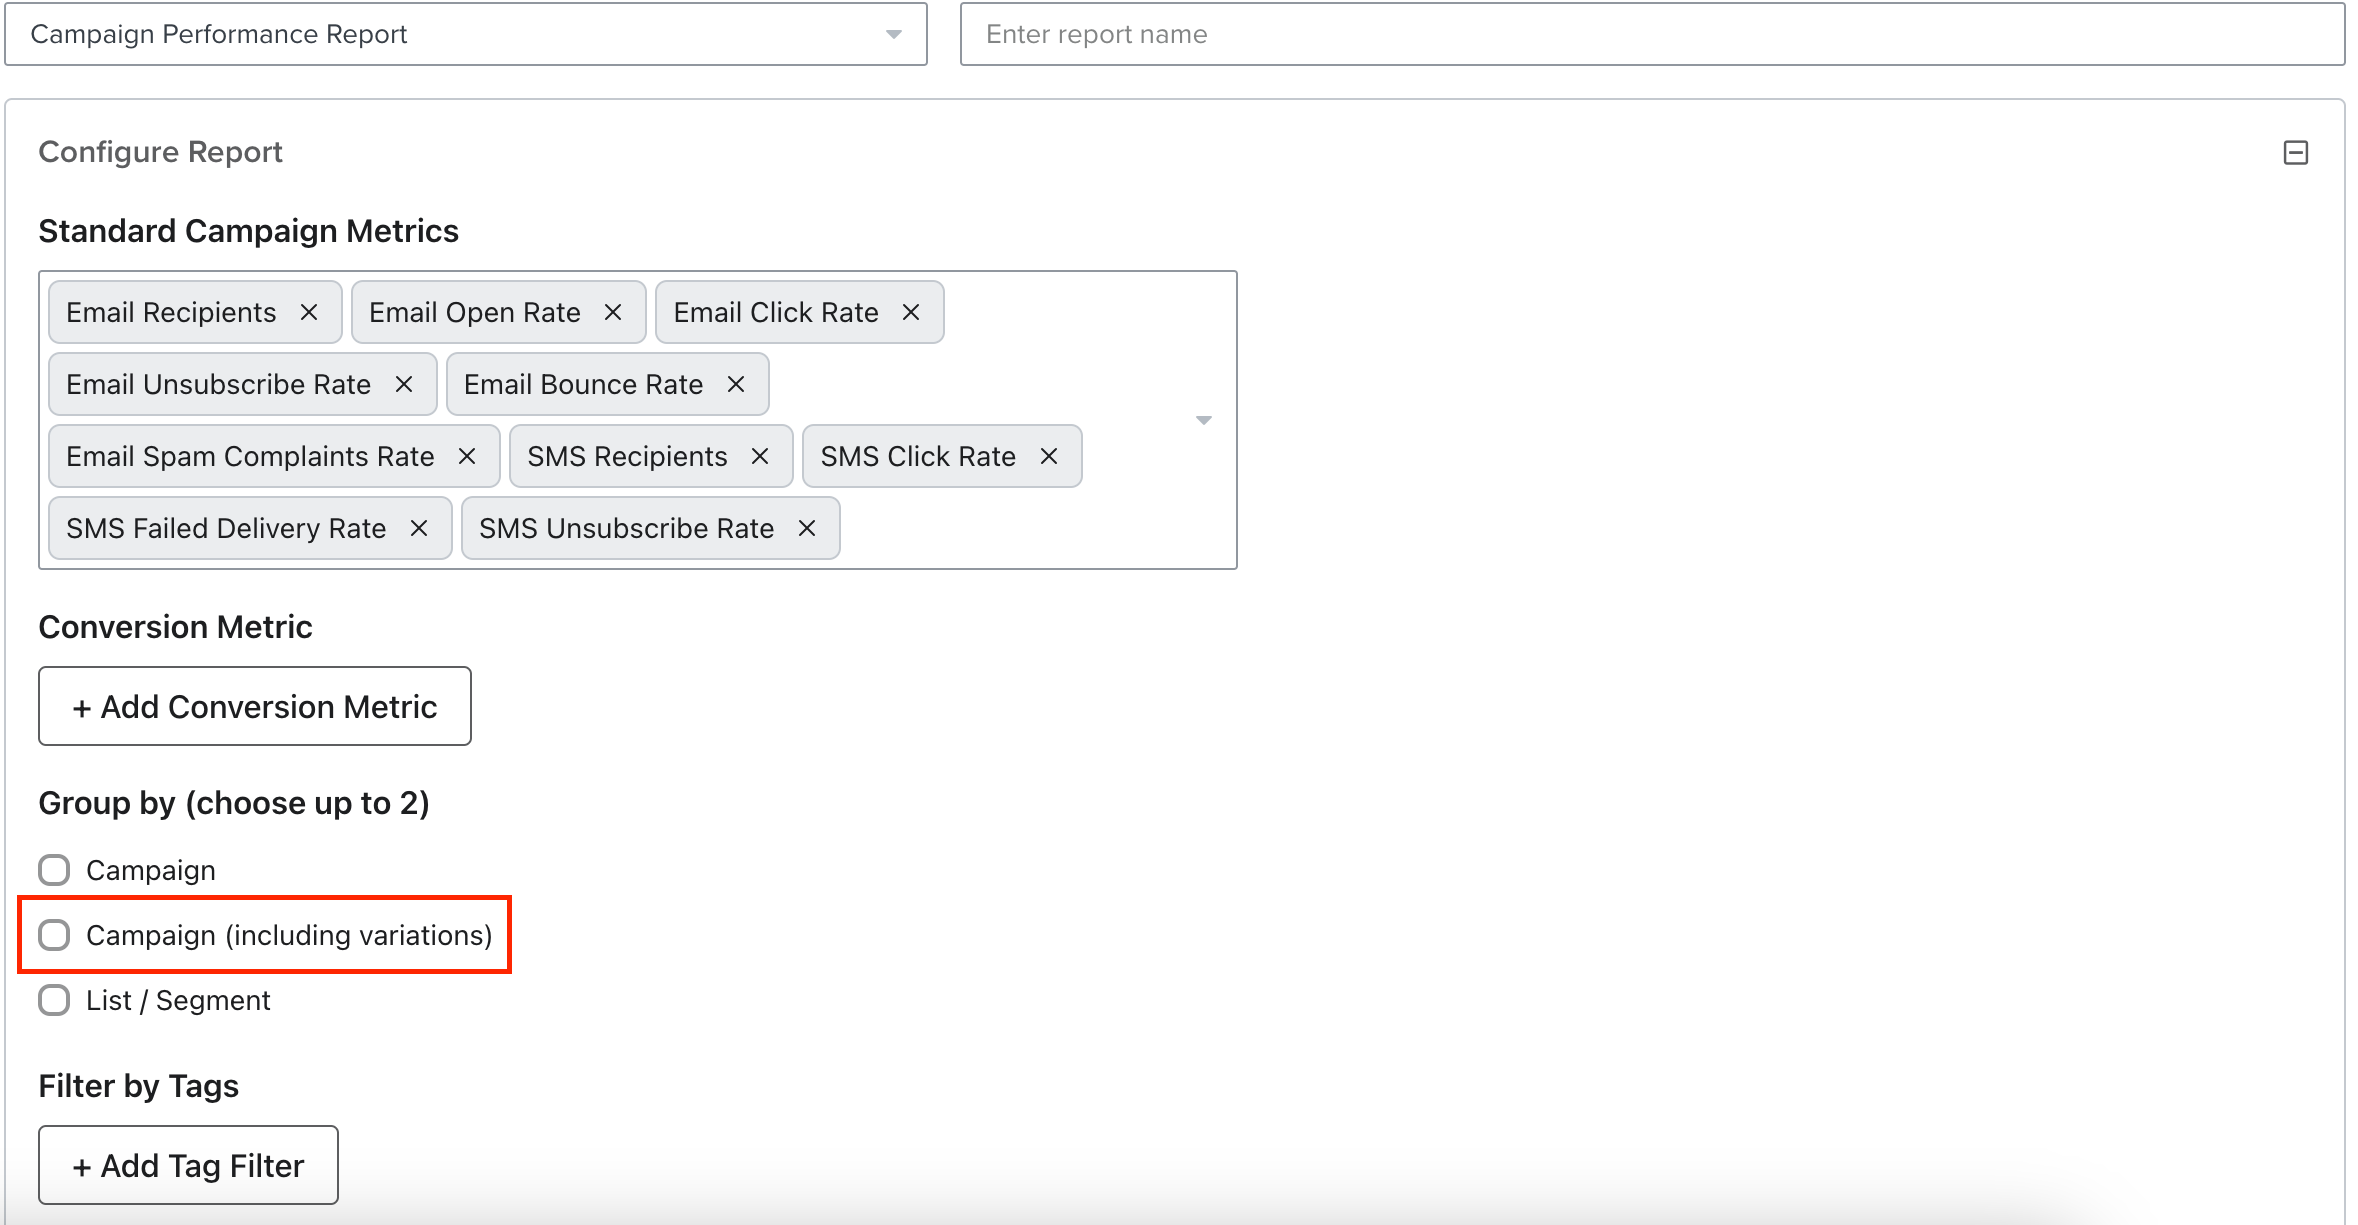
When you create a campaign performance report, under the Group by option, you can select Campaign (including variations).

If you haven’t already, I would also suggest taking a look into our How to build a campaign performance report Help Center article which also gives more insight into this.
David
Hey
You can absolutely view your campaign A/B test just like you can with a flow perfomrnace report by using a campaign performance report.
When you create a campaign performance report, under the Group by option, you can select Campaign (including variations).

If you haven’t already, I would also suggest taking a look into our How to build a campaign performance report Help Center article which also gives more insight into this.
David
Thanks a lot, David! I successfully followed your instruction.
By the way, I am trying to view the segment report overall (including both from campaigns and flows).
I read this article: https://help.klaviyo.com/hc/en-us/articles/115005906848
The engagement reports for lists and segments are not meeting my need since they only have 30 days timeframe. Ideally, I’d like to view most of everything from custom report including Standard Campaign Metrics (unique/total click/open/unsubscribe/ rate, etc., ) and Conversion Metric (placed order rate/value/total/sum/average/etc.) through different timeframe (365/90/etc.)
I thought of a workaround is to sum up those data through Campaign and Flow Performance Report.
However, in Custom Report section, as your screenshot, I can view report for List/Segment by Campaign, but regarding Flow Performance Report, I’ve checked everywhere and I can find neither the List/Segment checkbox (the one which Campaign Performance Report has), nor to Group/Filter by List/Segment.
I would like to view a specific segment’s overall performance/ behavior (disregarding the segment is sent by campaigns or flows).
Thanks in advance.
Hi there
Thanks for your question!
You’re right, this isn’t an option for our Flow performance report. I am happy to pass this feedback along to our product team. In the meantime, a way to get the overall data for the metrics you want would be to pull this information from the Best People feature within our metrics tab.
Navigate to Metrics on the menu on the left-hand side of the page, then click on the metric you want to work with. Once on the metric overview page, click on the Best People link at the top of the page. When on that page, click the Export button at the top of the page. In the modal that appears, you'll be able to select the list or segment that you want to export metrics for. You can repeat this process for each metric and list or segment you want to review, and analyze that data outside of Klaviyo.
Hope this helps!
-Taylor
Reply
Log in to the Community
Use your Klaviyo credentials
Log in with Klaviyo
Use your Klaviyo credentials
Log in with KlaviyoEnter your E-mail address. We'll send you an e-mail with instructions to reset your password.
