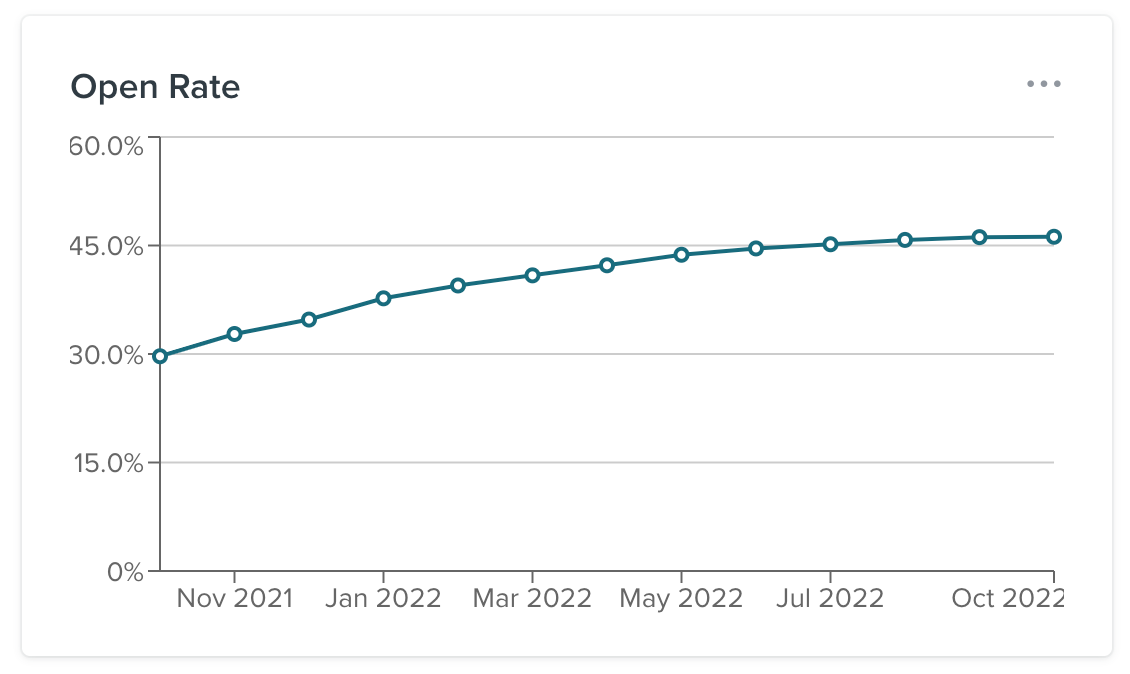
Hi, the previous dashboard had a way of creating a monthly, weekly, daily, yearly, trend chart for click-rates, open, rates, bounce rates, and spam rates for each individual flow, a flows aggregate, individual campaigns, and a campaign’s aggrigate.
I can’t find a way to create this type of chart.
Please help. This is having a big impact on my ability to create reports with trends. Thanks!

