Your best examples for the perfect analytics dashboard?

  • 17 March 2022
  • 5 replies
  • 206 views

Userlevel 2
Badge +7

Hey people!

I’ve seen a lot of good content here in Klaviyo’s community forum, but what I had issue finding was - examples of your reporting routine. 

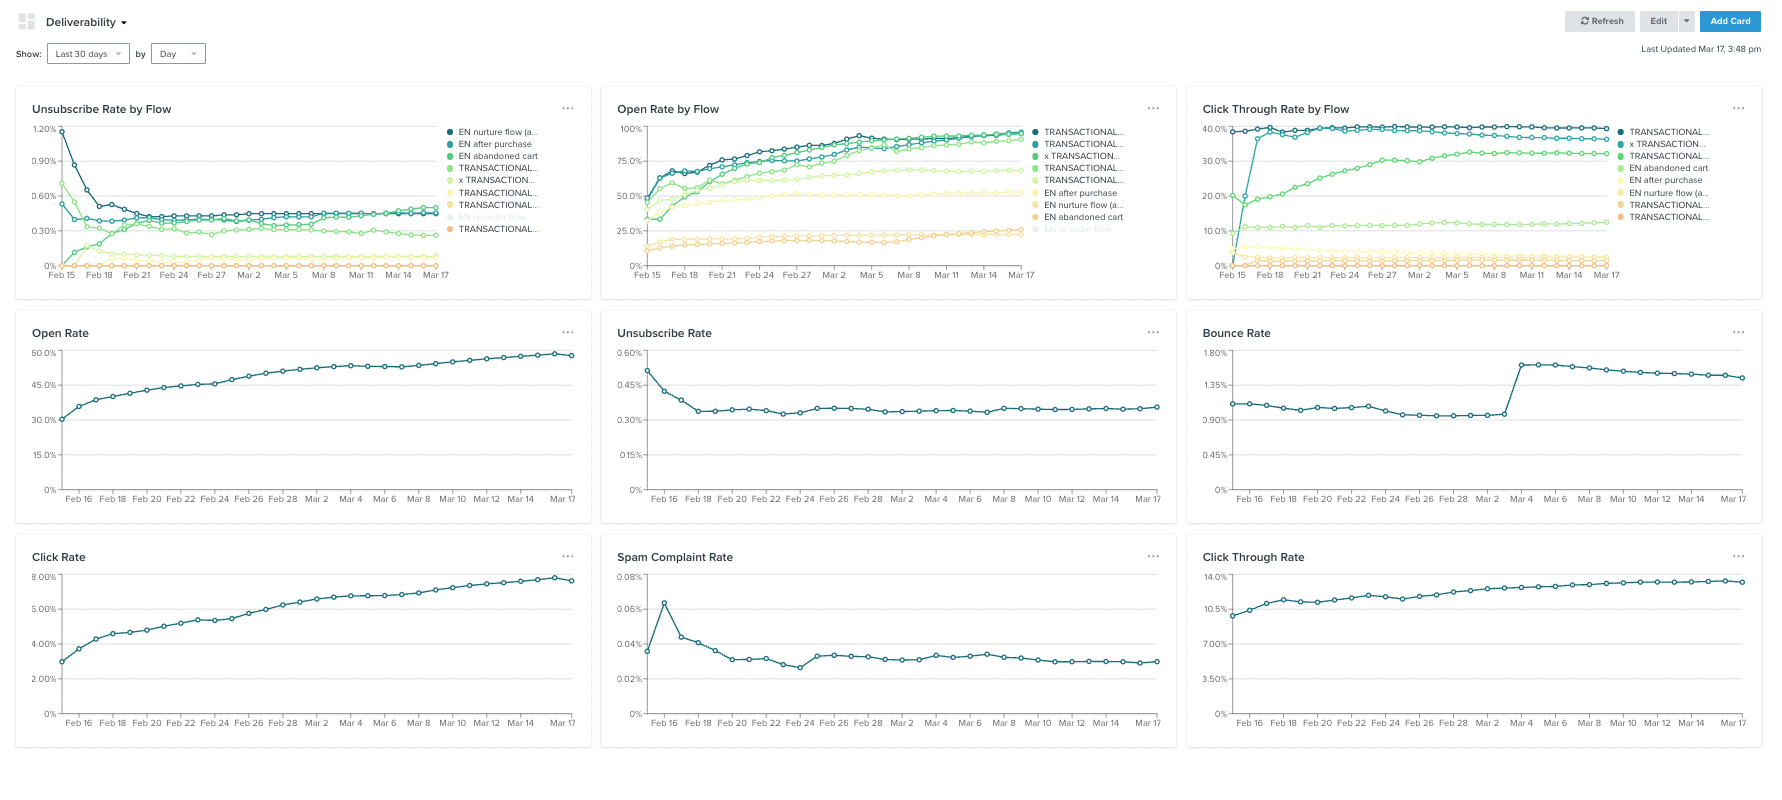
Had invested like 20 minutes in this guide from Klaviyo, I’ve managed to make a decent looking dashboard whereas it shows me the open rates, click rates, unsub rates, spam rates in the past 30 days (seeing the difference on a daily basis). And a few targeted dashboards for my flows. 

Here’s a picture so that you can make sense of it all: 


But I believe that I haven’t even scratched the surface. 

Do you have any helpful examples or something that I could add (or filter)?

Any advice would be very warmly welcomed!

Thanks


5 replies

Userlevel 7
Badge +60

Hey @moodxmanager 

Thank you so much for reaching out to the Klaviyo Community for more insight into analytics!

I am also very interested to hear what other community members are doing with their analytics dashboard. I know a lot of members also do amazing things with their revenue dashboard, have you started to build reporting around your revenue?

Userlevel 2
Badge +7

I haven’t, all due to the reason being that Klaviyo is not the best for tracking these things. We usually do GA + Looker or DS

Userlevel 4
Badge +9

I’d love to spend more time with the dashboard if it could be exported. Until that happens i’m going to fumble my way through data studio.

for anyone reading this in 2023 - with the new dashboard this one-view arrangement of core metrics isnt possible anymore.

Badge +2

@moodxmanager - I know it’s been a while since you posted this, but I wanted to share this article we wrote on how to set up a business dashboard with all the metrics you need to track. 


Reply