Hello! How I can find out the % for excellent, good, fair, poor etc. for key metrics (open rates, click rates, unsubscribe rates, bounce rates).
How can I find these figures to determine in my custom reports which metrics need improving?
Thanks!

 +2
+2Hello! How I can find out the % for excellent, good, fair, poor etc. for key metrics (open rates, click rates, unsubscribe rates, bounce rates).
How can I find these figures to determine in my custom reports which metrics need improving?
Thanks!
Best answer by zacfromson
Hi
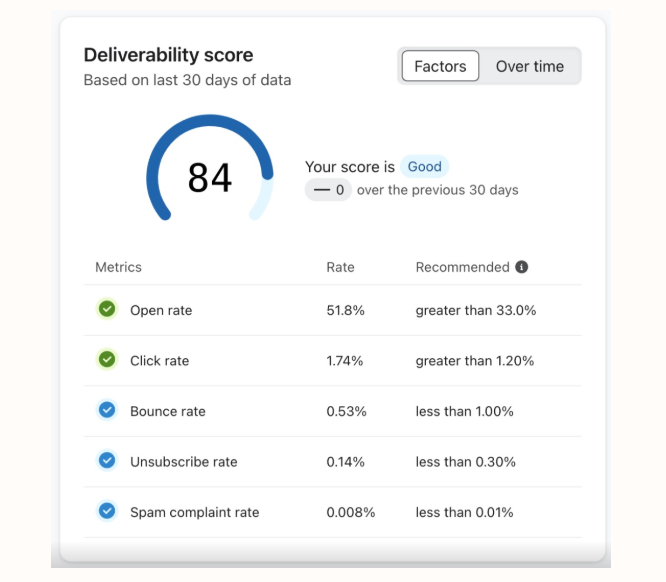
There are a couple of ways on Klaviyo to access benchmarks and evaluate performance across your metrics (open rates, click rates, unsubscribe rates, bounce rates):
1. Use Klaviyo Benchmarks (If Available)
If you’re on a paid plan, Klaviyo offers a Benchmarking tool that compares your account’s performance against similar brands (industry, size, and vertical). You can find this by going to:
Analytics > Benchmarks
This includes performance tiers like Top 25%, Median, and Bottom 25%, which you can use to categorize your metrics as excellent, good, fair, or poor.
2. General Benchmark Ranges (Across All Industries)
If benchmarks aren’t showing in your account, here’s a general guideline:
| Metric | Excellent | Good | Fair | Poor |
|---|---|---|---|---|
| Open Rate | 35%+ | 25–34% | 15–24% | <15% |
| Click Rate | 3.5%+ | 2–3.4% | 1–1.9% | <1% |
| Unsubscribe Rate | <0.2% | 0.2–0.4% | 0.4–0.6% | >0.6% |
| Bounce Rate | <0.5% | 0.5–1% | 1–2% | >2% |
3. Custom Reports Tip
When building custom reports (under Analytics > Custom Reports), you can:
• Pull in campaign/flow performance by metric
• Add conditional formatting (e.g., red for “poor”) if you export to Google Sheets or Excel
• Set up regular performance reviews using these categories
No account yet? Create an account
Enter your E-mail address. We'll send you an e-mail with instructions to reset your password.