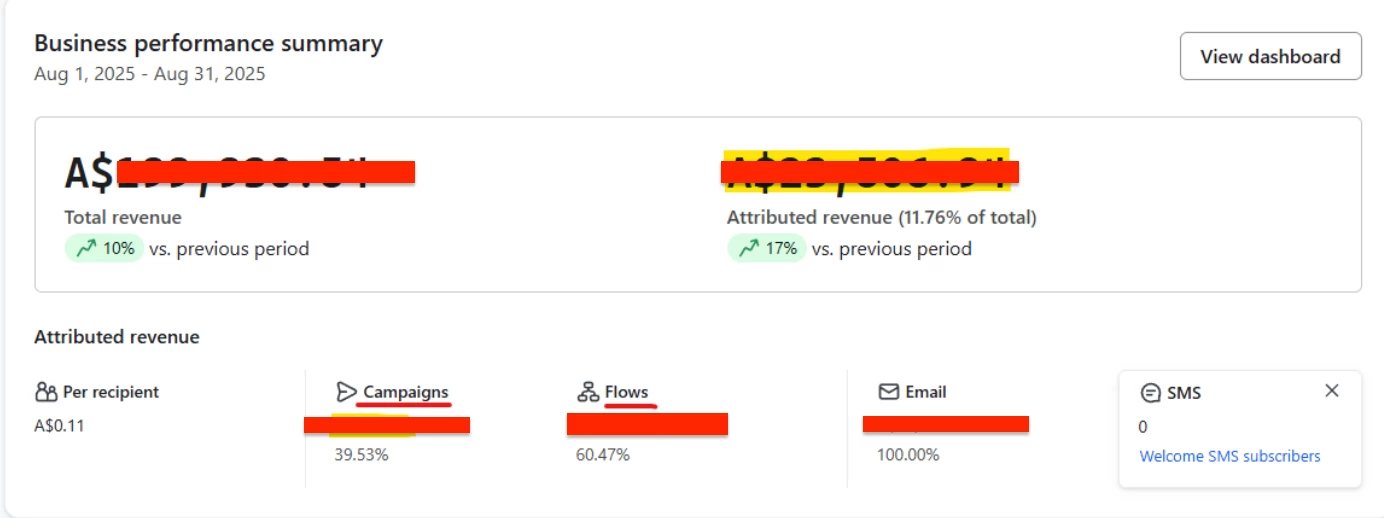

I’m trying to replicate the UI dashboard. I understand it may not match perfectly, but results that are close to what’s shown in the UI are acceptable. I’m using metric-aggregates, and here’s the body of my request:
{
    "data": {
        "type": "metric-aggregate",
        "attributes": {
            "measurements": [
                "unique",
                "sum_value",
                "count"
            ],
            "filter": [
                "greater-or-equal(datetime,2025-08-01)",
                "less-than(datetime,2025-08-31)",
                "not(equals($attributed_message,\"\"))"


            ],
"by": [
            "$attributed_message"
],
            "interval": "day",
            "metric_id": "placed order",
            "page_size": 500
        }
    }
}
For this example, I used the placed order metric ID.
I want to replicate this screenshot