Hi Community, 

I’m Jon from the product marketing team at Klaviyo, and I’m excited to share a new feature that would’ve made my life way easier when I was a Klaviyo customer. I spent eight years in ecommerce and digital marketing growing a fitness apparel brand called HYLETE. I know what it’s like to have endless marketing metrics and only enough time to work on improving a few. One of the biggest challenges I faced as a marketing director was prioritizing work that had the biggest opportunity to increase revenue.

I remember comparing HYLETE’s current performance to benchmarks from blog posts, industry experts, and our company’s own historical data. But none of these strategies transparently showed me how I was performing compared to similar companies—which would’ve given me more context to understand which metrics were already performing at their maximum potential and which had the most room for improvement. Klaviyo’s new Benchmarks feature does just that.

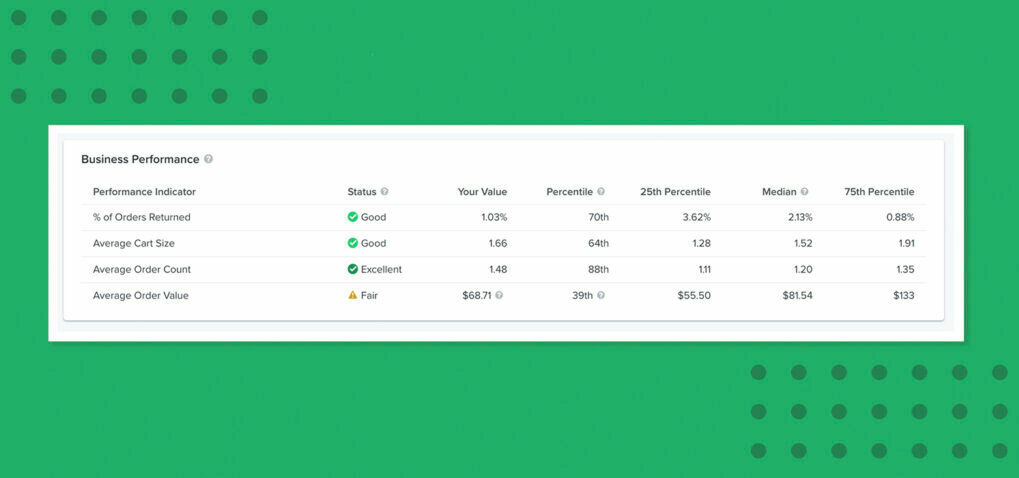
Benchmarks shows your brand’s performance compared to 100 businesses just like yours. In one click, you’ll see where you’re strongest and where you have the biggest opportunities for growth so you can invest your energy into the most impactful opportunities.


oBXdBOkBWK3lQsUFnX0dS-5LwsvKKFBdy-_cih0HmgwW56dIiYZ-udx43ddQXlI8TgKguH4qVIdvinTN1oa1Uej47GFrvAcwKE-QWaugxirAOydCEPCOlGZyvx-M5CKB5klpJrja

If you want to learn more about all the benchmarks Klaviyo reports on, or how we choose the 100 companies in your peer group, check out my blog post for more information or jump straight to your Benchmarks.
 

@Jon Palmer  Very excited to see how this tool will develop and improve over time. I love the idea of everyone sharing their data in this way as it’ll drive competition upwards and hopefully result in recipient’s having a better experience.


However, I’ve already found what I believe may be a huge flaw in the way the benchmark feature automatically maps real flows to your benchmark flow categories.


For example when I checked a client’s benchmark data for the “Welcome Series Flow,” category I noticed it was mapped to a flow that we titled “Smile.io | Welcome to loyalty program,” which is certainly not what anyone would consider a welcome series.


Our client’s true welcome series is actually a flow we titled “01 | Pre-purchase” flow.  So at this point, we don’t truly know how their welcome series performs against their peer group.  Conversely, if your welcome series category is pulling in data from our client’s smile.io flow, you’re also providing other companies in the peer group inaccurate data on our client’s performance for their Welcome series performance.


I thought maybe this would resolve itself by changing the flow title names of our flows by removing the word “welcome,” from the smile.io flow I mentioned above and adding “welcome,” to the title of their pre-purchase flow to say “01 | Pre-purchase ( welcome”. I see that my theory so far was incorrect. To be fair, it hasn’t even been 24 hours since I made these changes.


My immediate question is:

Will Klaviyo at any point remap our “01 | Pre-purchase ( welcome)” flow to your “welcome series Flow category soon on its own or is there something your team could do manually to adjust this?


The bigger question is:

Would it be possible for users to remap their own flows to the proper Benchmark Flow categories anytime soon?


I’m confident that the Klaviyo team will continue improving this feature but like any new product/feature, I’m not so confident that I can rely on the data it provides at the moment.


Thank you for all your hard work!


Hi @Mhagen !

I’m the Klaviyo Product Manager working on Benchmarks. We’re happy you’re excited about this new feature, and thanks for all of your great feedback!

You have pinpointed the number one feature request for Benchmarks thus far. Our flow classifying algorithm is solid, but as with any algorithm, there is some error. As a result, we know that we need to give users the power to update the flows for each category, and we aim to release that functionality in Q1. I’m sorry for the temporary frustration, but hang tight for a month or two!

In the meantime, we update Benchmarks every month by the 10th of the month. Every time we update the data, we refresh the flows for each category, so your changes will take effect when we release the data for December 2020, which should happen in the next few days. Specifically for the Welcome Series Flow, we do look for flows with the word “Welcome” in the name, so your intuition was correct. When the data updates in the next few days, you should see the correct Welcome Series Flow (i.e., 01 | Pre-purchase ( welcome)) displayed. 

Let us know if you have any more questions!

Thanks,

Mark


@Mhagen I’m really glad you see the same potential in the feature that I do, but I also completely sympathize that Klaviyo is not pulling in the correct flows immediately so the Benchmarks you see are not useful yet. 

As Mark said we are working on a fix as I type this. Thanks for diving into the Benchmarks feature!


Got this today and was excited to give it a go, very interesting stats, our flows are not good, whereas everywhere else is in the high 90’s

great new feature :) 


@dan deyong I just took a look and your Welcome Series Click %’s are the lowest hanging fruit that could be improved and generate more revenue for you.

The biggest issue I see right off the bat is that email #1 in your welcome series does not have any links in the images or in the CTA button. Therefore, Klaviyo cannot record a click and that is dragging down your click rate Benchmark. 

Personally, I would test calling out the 20% off and the code needed to activate the discount in each email of your welcome flow and see if that helps with the click rate in the other Welcome Series emails too.

Glad Benchmarks brought our attention to this and what is hopefully an easy fix to improve your click rate.

Many thanks for your help, have amended your suggestions, lets hope this improves :relaxed:


@markpiana I definitely like the new benchmarks feature.. I am curious if your algorithm averages out the percentages (click, open, conversion, etc.) based on how many emails are in a flow.. 


For example, how do you compare companies who have just 1 email in their welcome flow which brings in 70% open rates and 20% clicks because of a coupon code, against a welcome flow with 6+ emails... where open, click and conversion rates average down when you take in account all ofthe emails. 


@Travis Great question! Currently, we are not accounting for the number of emails in a flow. Instead, we’re simply averaging the percentages across all of the emails in a flow - an approach that we know has drawbacks. We have the ability to compare specific emails in a flow to each other on the roadmap, but I do not have a specific timeline for when that update will be available. 


@Mhagen we’re a couple months behind schedule, but as of today, you should be able to update any flows you see selected in Benchmarks!


Reply