Solved

Discrepancy between API endpoint /api/metric-aggregates/ and exported reporting data


Forum|alt.badge.img+3

Hey Klaviyo team,

We extracted data for one of our clients using endpoint /api/metric-aggregates/.

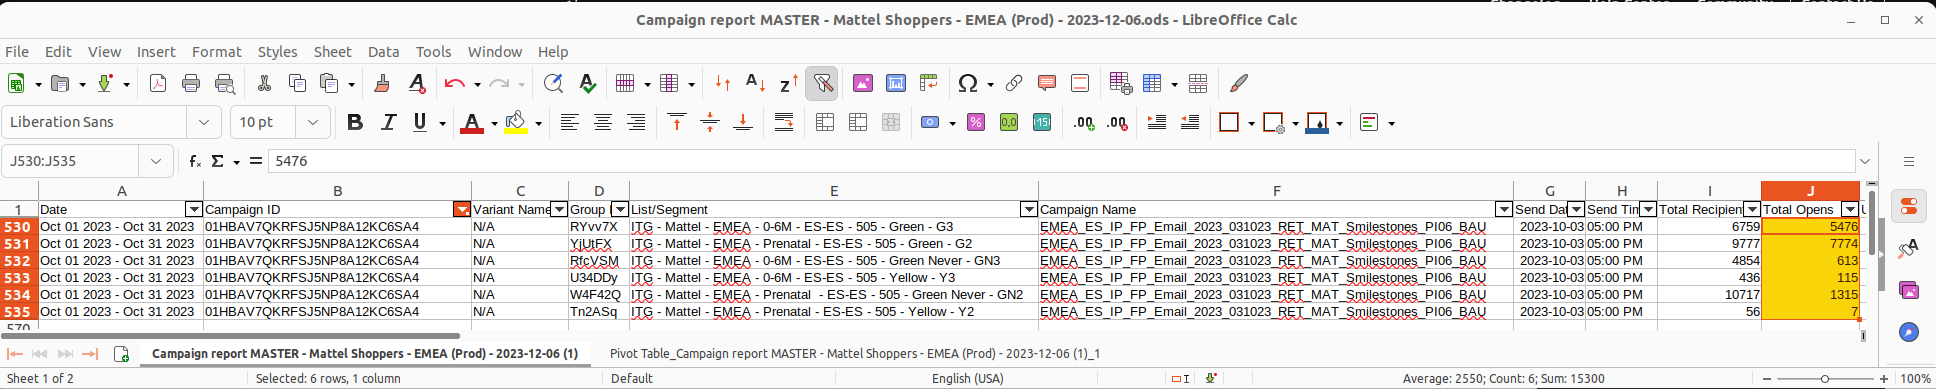
However, the client complains about data discrepancy. For example, campaign with ID 01HBAV7QKRFSJ5NP8A12KC6SA4 in the exported reporting data has “Total Opens” = 15300:

But statistics for metric "Opened Email" (TaxZXt) returned 13462:

POST /api/metric-aggregates/ HTTP/1.1
Host: a.klaviyo.com
Authorization: Klaviyo-API-Key {{api_key}}
revision: 2023-10-15
Accept: application/json
Content-Type: application/json
Content-Length: 407

{
  "data": {
    "type": "metric-aggregate",
    "attributes": {
      "metric_id": "TaxZXt",
      "interval": "month",
      "measurements": [
        "count"
      ],
      "filter": [
        "greater-or-equal(datetime,2023-10-01T00:00:00)",
        "less-than(datetime,2023-11-01T00:00:00)"
      ],
      "by": [
        "$message"
      ],
      "page_size": 500,
      "timezone": "UTC"
    }
  }
}

Part of the response for campaign with ID 01HBAV7QKRFSJ5NP8A12KC6SA4:

                {
                    "dimensions": [
                        "01HBAV7QKRFSJ5NP8A12KC6SA4"
                    ],
                    "measurements": {
                        "count": [
                            13462.0
                        ]
                    }
                },

Could you please clarify what’s a reason for the discrepancy?


Kind regards,

Evgeniy

Best answer by saulblum

I’m assuming that Group column in the CSV export are segments? Is it possible that if a profile that opened an email from the campaign is in more than one of those six segments, they would be counted multiple times? The raw Opened Email count is segment-agnostic; it’s just tallying up Opened Email events. But if you’re breaking the profiles down by segments and a profile is in multiple segments, that event will count towards multiple rows, hence the inflated numbers.


Just a hunch.

View original
Did this topic or the replies in the thread help you find an answer to your question?

3 replies

Forum|alt.badge.img+7
  • Klaviyo Employee
  • 169 replies
  • December 20, 2023

Hi, often these differences are from when the events are recorded. When you look at the email opens for a campaign, it will give you all the email opens, regardless of when they happened. When you use the API to query for specific events in a given time, it is only counting events that happened in that window. So if a campaign is sent September 15 and on November 1 you get all the campaign’s email opens, it will be around 45 days worth of events. If you use the API with a October 1 to November 1 window for email opens attributed to a campaign, it will only count email opens that happened during that month, and not include any email opens that happened between September 15 and 30.


Forum|alt.badge.img+3
  • Author
  • Contributor IV
  • 8 replies
  • December 21, 2023

Hi saulblum,

Thank you for looking here!

If I got right you explanation, the client exported all campaigns that were started in Oct 2023 with their lifetime metrics values.

I’ve checked “Total Opens” for the campaign 01HBAV7QKRFSJ5NP8A12KC6SA4 from starting till now and got value 13787 - it still many smaller then 1500.

Could you please explain it as well?

Kind regards,

Evgeniy


Forum|alt.badge.img+7
  • Klaviyo Employee
  • 169 replies
  • Answer
  • December 21, 2023

I’m assuming that Group column in the CSV export are segments? Is it possible that if a profile that opened an email from the campaign is in more than one of those six segments, they would be counted multiple times? The raw Opened Email count is segment-agnostic; it’s just tallying up Opened Email events. But if you’re breaking the profiles down by segments and a profile is in multiple segments, that event will count towards multiple rows, hence the inflated numbers.


Just a hunch.