Hi, the previous dashboard had a way of creating a monthly, weekly, daily, yearly, trend chart for click-rates, open, rates, bounce rates, and spam rates for each individual flow, a flows aggregate, individual campaigns, and a campaign’s aggrigate.
I can’t find a way to create this type of chart.
Please help. This is having a big impact on my ability to create reports with trends. Thanks!
Best answer by stephen.trumble
Hey @Andrew.Walters
Thanks for asking about your dashboard reports. The Analytics section will gather all data reporting tools in one place.
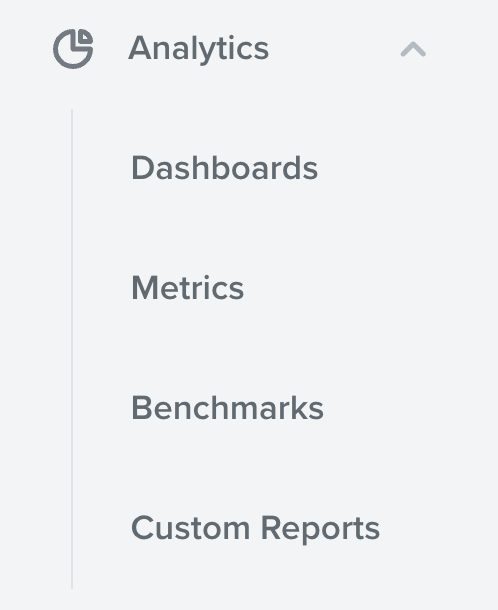
By clicking on the Analyticssection to expand the menu, you will see the options for:
Dashboards
Metrics
Benchmarks
Custom Reports
From here, you can navigate and use any of these Klaviyo tools as you previously did.
Also check out this other community post that covers all of the changes to the new navigation experience.