Solved

Data mismatch between API and Klaviyo dashboard


Badge +2

Hello,

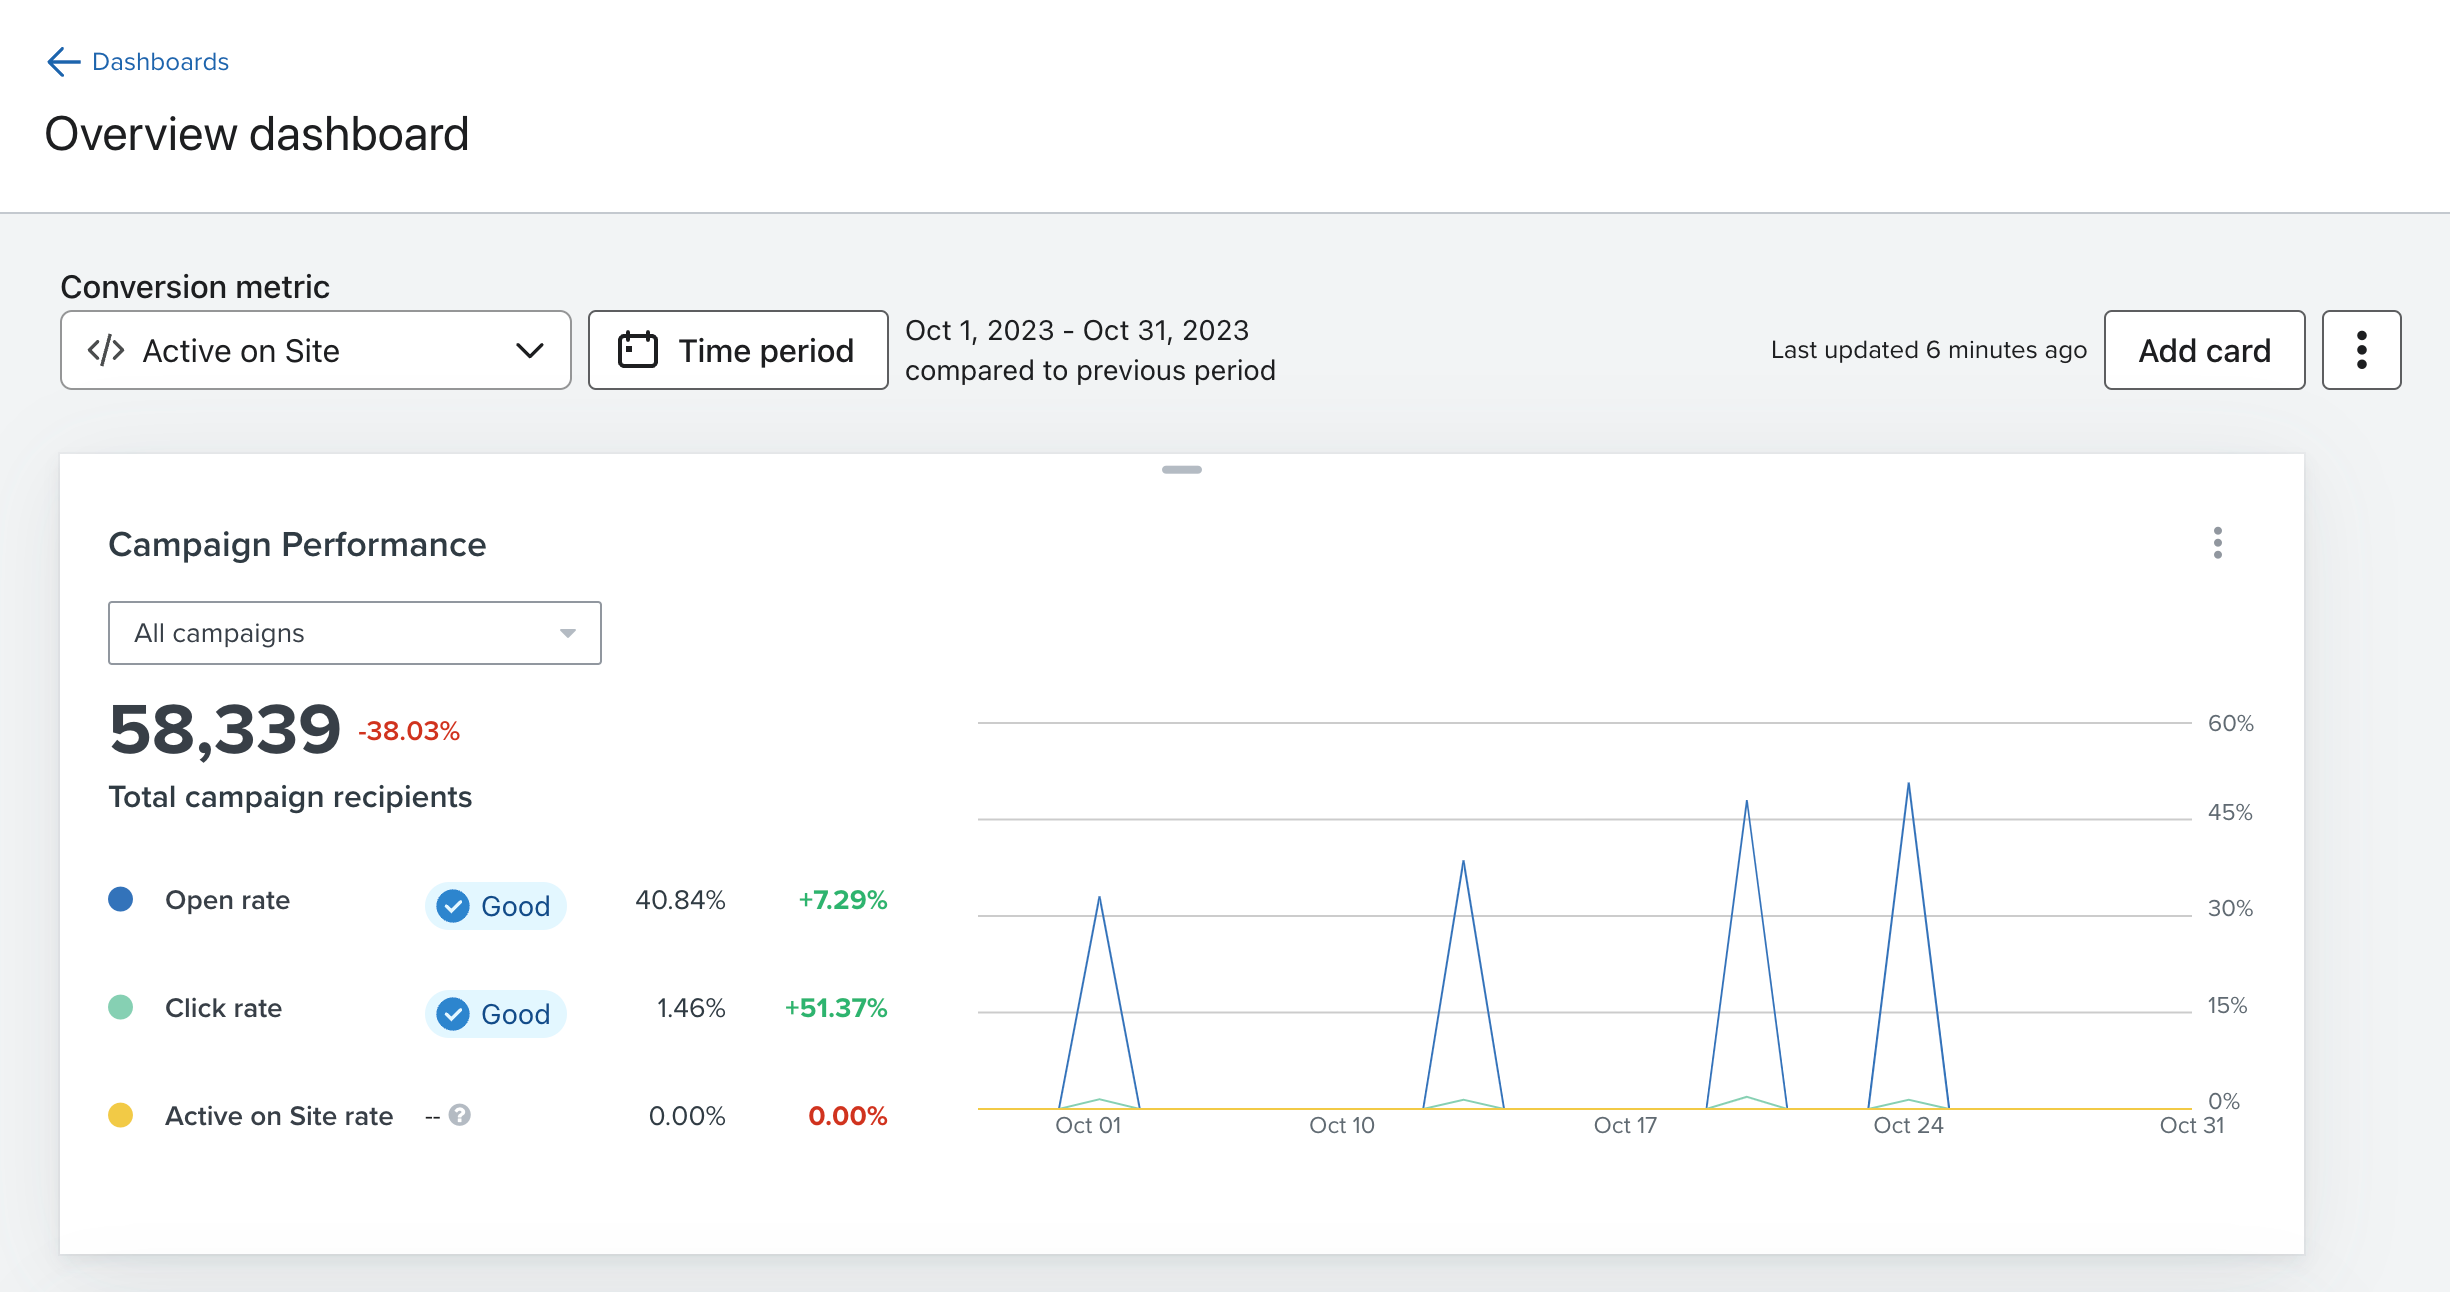
We’ve noticed some mismatches between the data that we get from the API and the data on the Klaviyo dashboard.

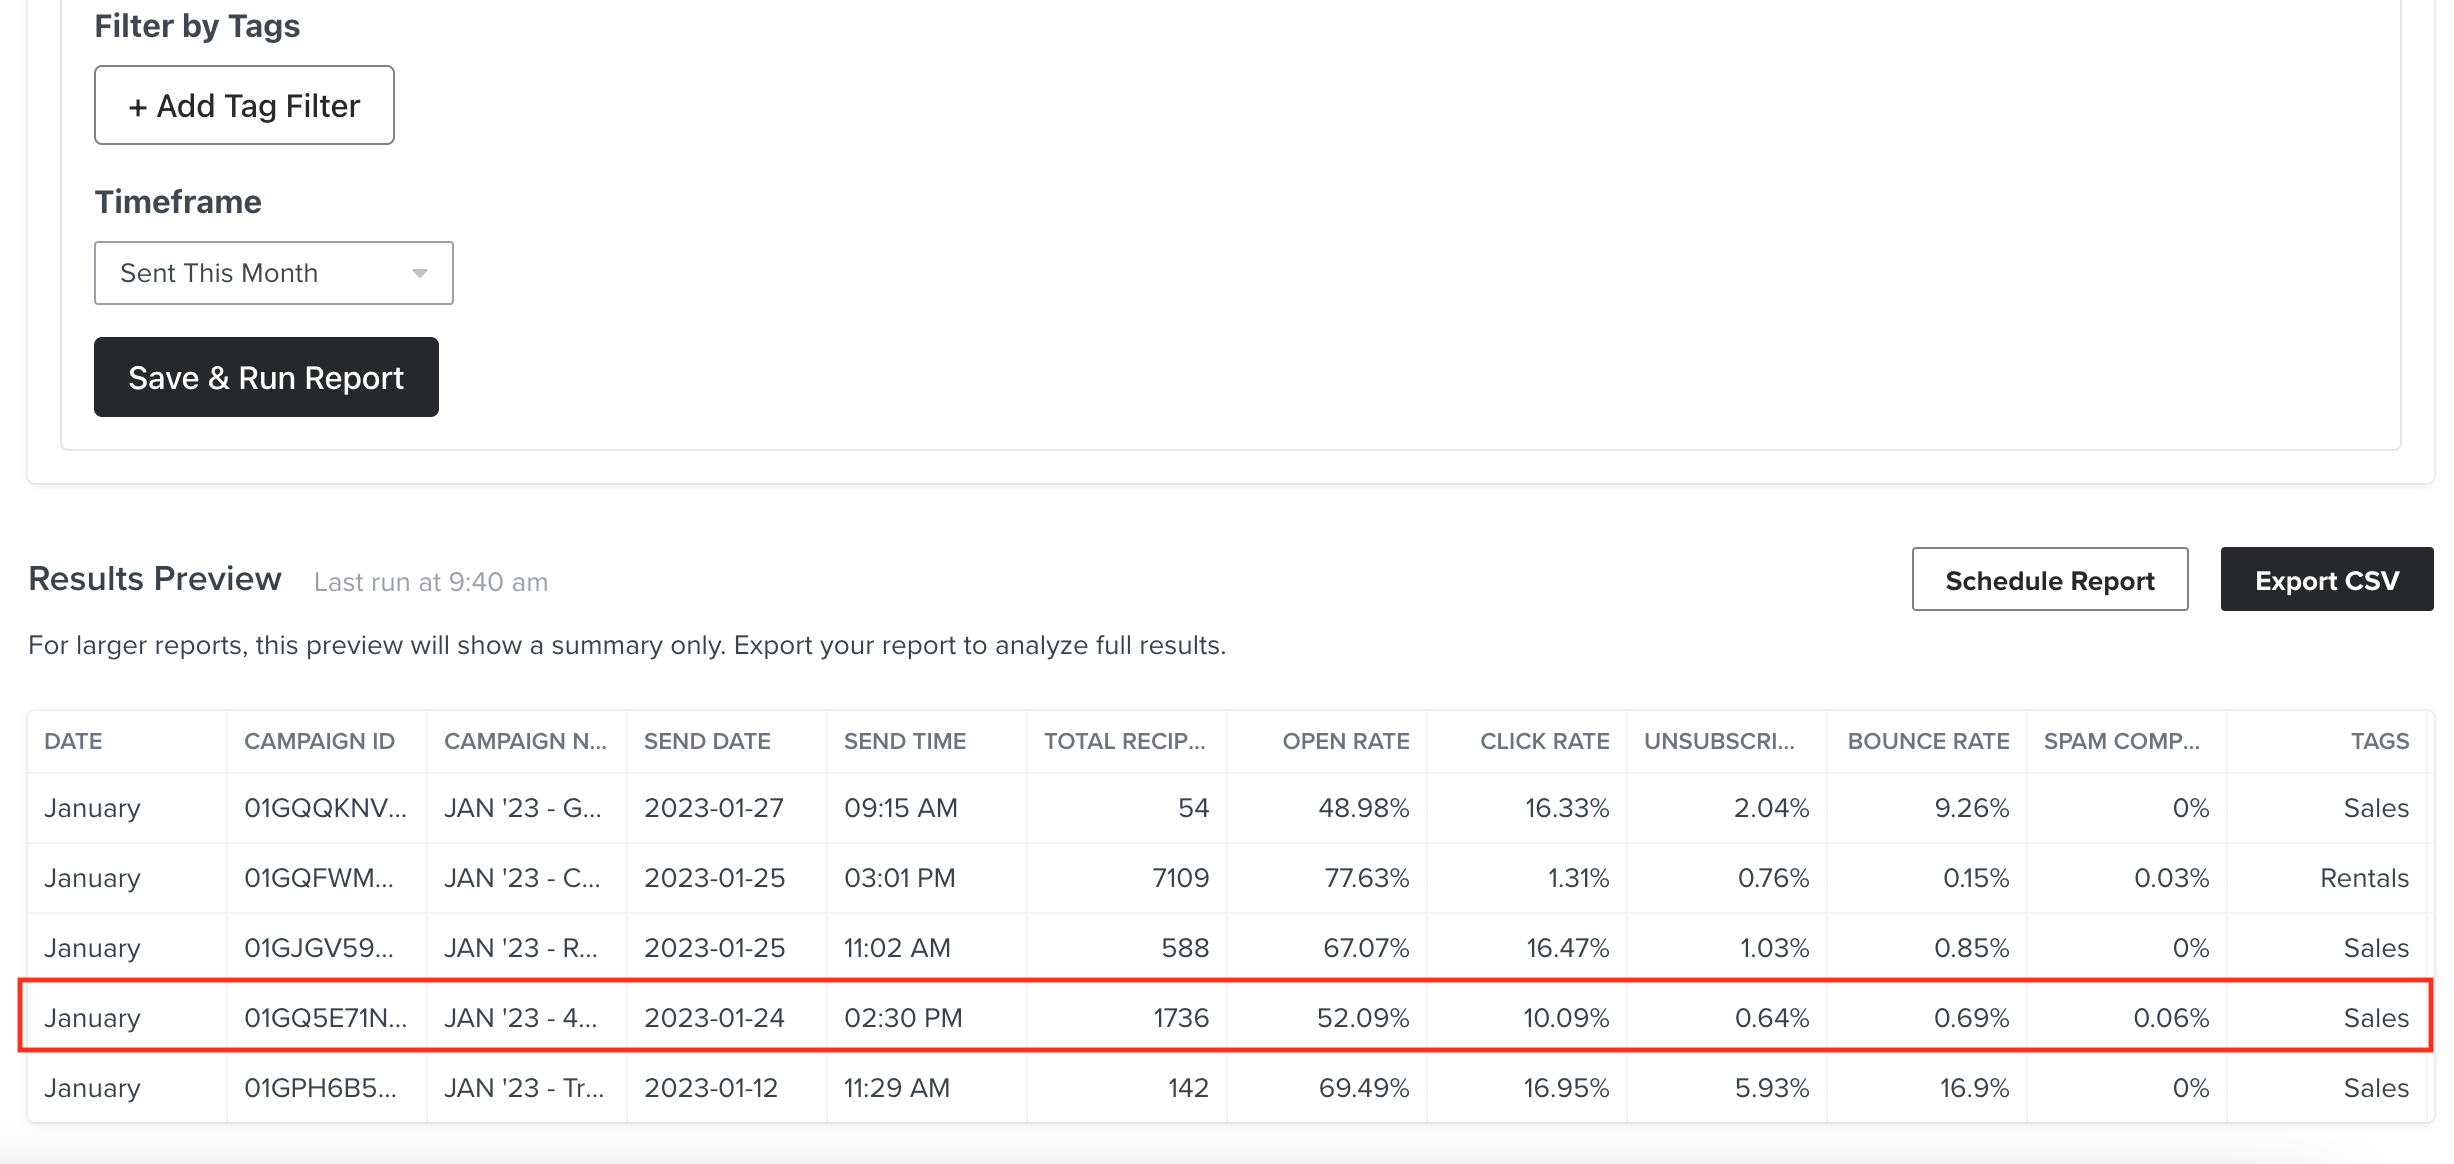
For the campaign highlighted in red here for example, the API returns 1756 for the recipient count.

Moreover, the click rate and open rate don’t match either. We arrive at 63.38% for the open rate by computing unique email opens / recipient count. This is not explained by the recipient count mismatching alone obviously, so there is a discrepancy in the email open count as well.

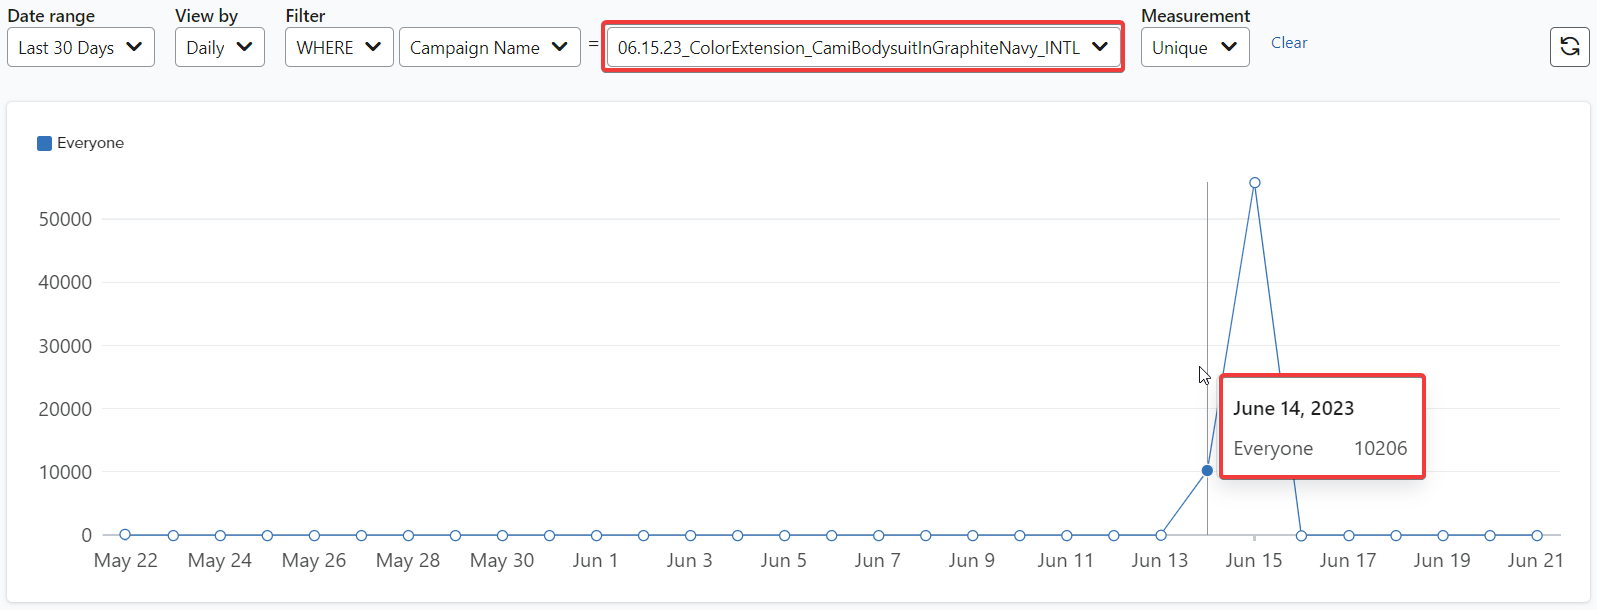
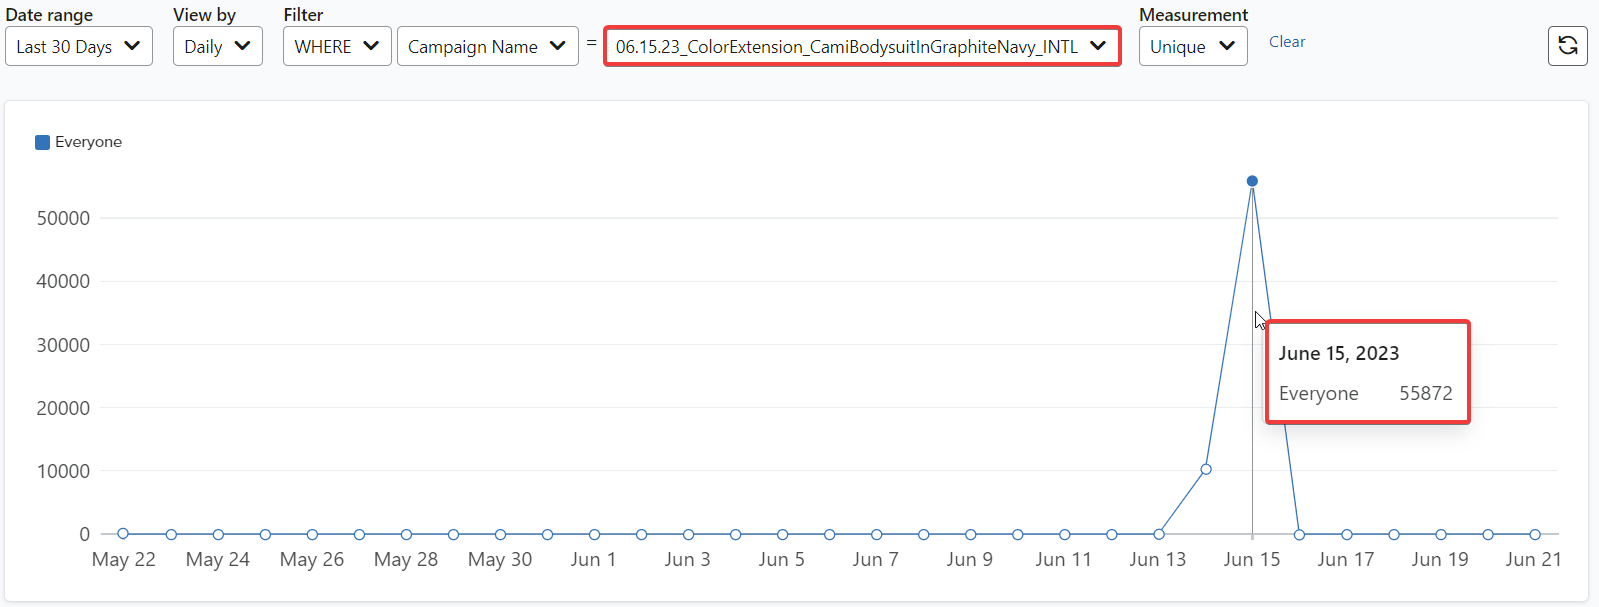
Finally, the value for opened emails is different if we request them by day vs by month for the same 30 day date range. When going by day, the total is 1.113, however if we set unit to month, the result is 906.

Could someone provide some insight into this?

(API responses below)

{
"metric": {
"object": "metric",
"id": "X5h9ua",
"name": "Opened Email",
"integration": {
"object": "integration",
"id": "0rG4eQ",
"name": "Klaviyo",
"category": "Internal"
},
"created": "2022-02-04 19:52:47",
"updated": "2022-02-04 19:52:47"
},
"start_date": "2023-01-01 00:00:00",
"end_date": "2023-01-31 00:00:00",
"unit": "daily",
"measurement": "q",
"by": "",
"where": [
[
"$message",
"=",
"01GQ5E71NMD2SVRYG3AC6D5Q30"
]
],
"results": [
{
"segment": "Everyone",
"data": [
{
"date": "2023-01-01 00:00:00",
"values": [
0.0
]
},
{
"date": "2023-01-02 00:00:00",
"values": [
0.0
]
},
{
"date": "2023-01-03 00:00:00",
"values": [
0.0
]
},
{
"date": "2023-01-04 00:00:00",
"values": [
0.0
]
},
{
"date": "2023-01-05 00:00:00",
"values": [
0.0
]
},
{
"date": "2023-01-06 00:00:00",
"values": [
0.0
]
},
{
"date": "2023-01-07 00:00:00",
"values": [
0.0
]
},
{
"date": "2023-01-08 00:00:00",
"values": [
0.0
]
},
{
"date": "2023-01-09 00:00:00",
"values": [
0.0
]
},
{
"date": "2023-01-10 00:00:00",
"values": [
0.0
]
},
{
"date": "2023-01-11 00:00:00",
"values": [
0.0
]
},
{
"date": "2023-01-12 00:00:00",
"values": [
0.0
]
},
{
"date": "2023-01-13 00:00:00",
"values": [
0.0
]
},
{
"date": "2023-01-14 00:00:00",
"values": [
0.0
]
},
{
"date": "2023-01-15 00:00:00",
"values": [
0.0
]
},
{
"date": "2023-01-16 00:00:00",
"values": [
0.0
]
},
{
"date": "2023-01-17 00:00:00",
"values": [
0.0
]
},
{
"date": "2023-01-18 00:00:00",
"values": [
0.0
]
},
{
"date": "2023-01-19 00:00:00",
"values": [
0.0
]
},
{
"date": "2023-01-20 00:00:00",
"values": [
0.0
]
},
{
"date": "2023-01-21 00:00:00",
"values": [
0.0
]
},
{
"date": "2023-01-22 00:00:00",
"values": [
0.0
]
},
{
"date": "2023-01-23 00:00:00",
"values": [
0.0
]
},
{
"date": "2023-01-24 00:00:00",
"values": [
718.0
]
},
{
"date": "2023-01-25 00:00:00",
"values": [
210.0
]
},
{
"date": "2023-01-26 00:00:00",
"values": [
61.0
]
},
{
"date": "2023-01-27 00:00:00",
"values": [
37.0
]
},
{
"date": "2023-01-28 00:00:00",
"values": [
24.0
]
},
{
"date": "2023-01-29 00:00:00",
"values": [
24.0
]
},
{
"date": "2023-01-30 00:00:00",
"values": [
21.0
]
},
{
"date": "2023-01-31 00:00:00",
"values": [
18.0
]
}
]
}
]
}
{
"metric": {
"object": "metric",
"id": "X5h9ua",
"name": "Opened Email",
"integration": {
"object": "integration",
"id": "0rG4eQ",
"name": "Klaviyo",
"category": "Internal"
},
"created": "2022-02-04 19:52:47",
"updated": "2022-02-04 19:52:47"
},
"start_date": "2023-01-01 00:00:00",
"end_date": "2023-01-31 00:00:00",
"unit": "monthly",
"measurement": "q",
"by": "",
"where": [
[
"$message",
"=",
"01GQ5E71NMD2SVRYG3AC6D5Q30"
]
],
"results": [
{
"segment": "Everyone",
"data": [
{
"date": "2023-01-01 00:00:00",
"values": [
906.0
]
}
]
}
]
}


icon

Best answer by Brian Turcotte 22 February 2023, 19:28

View original

11 replies

Userlevel 7
Badge +36

Hi @TianaS!


The most likely explanation of this has to do with Klaviyo’s attribution model. An excerpt from this Help Center Article explains how event data like clicks and opens are measured in reports and dashboards:

For those reports that do not use the message attribution windows, any event data (e.g., opens and clicks) are grouped based on the date those specific events happen. They will not be based on the day an attributed message was sent.


This means that while reports/dashboards use Klaviyo’s attribution model to determine the dates by which to attribute data (based on the date the attributed message was sent), the individual event data of opens and clicks are grouped by the date that they individually occur.


Here are a few more Community threads that discuss similar topics:


I hope this helps to clarify, and thanks for using the Community!

- Brian

Badge +2

Thanks Brian,


Is there a way to get the exported data from the /metric endpoint to use the same attribution model/match the data in the dashboard?

Userlevel 7
Badge +36

Hi @TianaS!


I checked in with Engineering, and it turns out that they are aware of this discrepancy and haven’t been able to replicate the dashboard exactly, due to subtle differences in the way they both calculate attribution.


I will update the thread as soon as there is any news regarding updated functionality here.


Thanks,

Brian

Badge +2

Hi Brian, 


Thank you for the update. Would you let me know if this is something planned within your team? 


On the other hand, We’ve noticed that not just event data is mismatched but also the recipient. Does the attribution window also affect the number of the recipient? 
 

Userlevel 7
Badge +36

Hi @TianaS,


I will forward that additional feedback, but yes - improving the reporting and mirroring of our dashboard via API is definitely on our team’s radar. I will update the thread when there is any more info here.


Thanks,

Brian

Hi @Brian Turcotte and @TianaS ,

We found the same problem. From API, using the same campaign (‘06.15.23_ColorExtension_CamiBodysuitInGraphiteNavy_INTL’), we have fewer events (received) than in the Klaviyo interface.

Attached screenshots:

  • From API:


  • From Klaviyo UI:


Is there any justification or solution for this discrepancy?

Thanks!

Userlevel 7
Badge +36

Hi @LluisGasso!
 

Would you be willing to share the actual API call you made here (with all sensitive information redacted)?


However, for this case, it may be more helpful to create a ticket directly with Support since this is a highly customizable use case, and involves variables that are specific to your account.


Best,

Brian

Userlevel 1
Badge +2

Hi @Brian Turcotte ! I’m going to piggyback on this thread because I am experiencing the exact same issue with the Open Rate calculation.

The Open Rate on the Klaviyo platform for the month of October is 40.84%, as seen here below: 


However, when I use the data from the API to calculate the Open Rate, I do not get the same result. I tried with both the legacy versions of the API and the new one, and I get the same discrepancies.

The call I use to get the Metrics data is https://a.klaviyo.com/api/metric-aggregates
with the following body: 

{
"data": {
"type": "metric-aggregate",
"attributes": {
"metric_id": "Wzi5Ai",
"interval": "month",
"page_size": 500,
"timezone": "UTC",
"measurements": [
"unique", "count"
],
"filter": [
"greater-or-equal(datetime,2023-10-01),less-than(datetime,2023-11-01)"
]
}
}
}

So the results I get for each metric is:

Received Emails count 57562
Received Email unique 26526

Opened Emails count 39476
Opened Emails unique 15727

When I use the calculation from this link to get the Open Rate https://developers.klaviyo.com/en/docs/using_the_query_metric_aggregates_endpoint#open-rate-open_rate
I get either 68.58% for total open rate or 59.29% for unique open rate, but it is nothing near the value I get on the Klaviyo platform, which is 40.84%.

So I wonder where the discrepancy is coming from? Could it be because of different attribution models as you mentioned earlier? Is there a way to fix this?


Thank you,


Marie

Userlevel 7
Badge +36

Hi @Nymesia & @TianaS!

Our API team is currently working on something to remedy these discrepancies, so I will update the thread when that happens!

Best,

Brian

Badge +1

@Brian Turcotte thanks for the update.

Also raising my hand as I’m noticing a big difference in unique opens compared to when I export from Dashboard.

This is a big problem for API users, if we can’t trust the data then the whole API is becomes worthless.

Userlevel 7
Badge +36

Hi @JasonEdward!

Our API team is currently working a more streamlined way to match custom dashboards via the API - so I will update the Community when that is released!

Best,
Brian

Reply