
How 4 brands use Klaviyo data to understand their customers, not just market to them
Most people set up profiles, segments, and events to power sends. Properties personalize the email. Segments decide who gets it. Events tell a flow when to fire. But somewhere in that setup, it's easy to stop asking what the data is actually telling you about the people receiving it.
I asked four Klaviyo Champions to open up their own accounts and share what happened when they stopped treating their data as backend plumbing and started asking what it actually said about their customers. Between them, they cover four building blocks most of us touch every day: profiles and properties, segments, flow engagement, and event tracking.
What they found didn't always match what they expected. A return they assumed meant churn. A no-show list that was actually a growth opportunity. A quiz answer that changed a product roadmap. A winback flow that revealed apathy instead of neglect.
Here's what four brands learned when they stopped treating their data as a formality and started treating it as a conversation.
What our profile data taught us about who's actually on our list
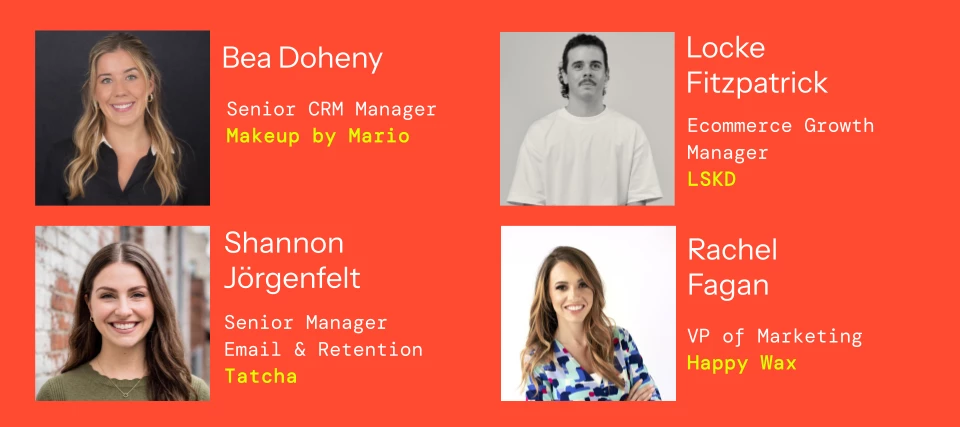
Rachel Fagan, VP of Marketing at Happy Wax
About two years ago, we shifted from thinking about the people on our list as customers to thinking about them as a community. That mindset pushed us to dig into our profile data instead of treating it as backend plumbing for sends. Once we started asking who these people actually were, we realized our list looked different than we assumed. What we'd been reading as one-time purchase behavior was often someone building a collection over time, changing the way we thought about what we needed to track.
So we started storing a lot more. We track product ownership and preferences at a more detailed level, along with purchase and return behavior. We also collect information directly from our community through quizzes and surveys, giving us additional context that purchase data alone can't provide.
We intentionally bring all of that data into Klaviyo rather than leaving quiz responses in one platform, purchase history in another, and survey data somewhere else. Having it in one place gives us a more holistic view of each person and creates a single source of truth for our customer data. We can see what someone has bought alongside what they've returned, what they've told us they like, what matters to them, and how they've engaged with us over time
How did a scent quiz influence product development?
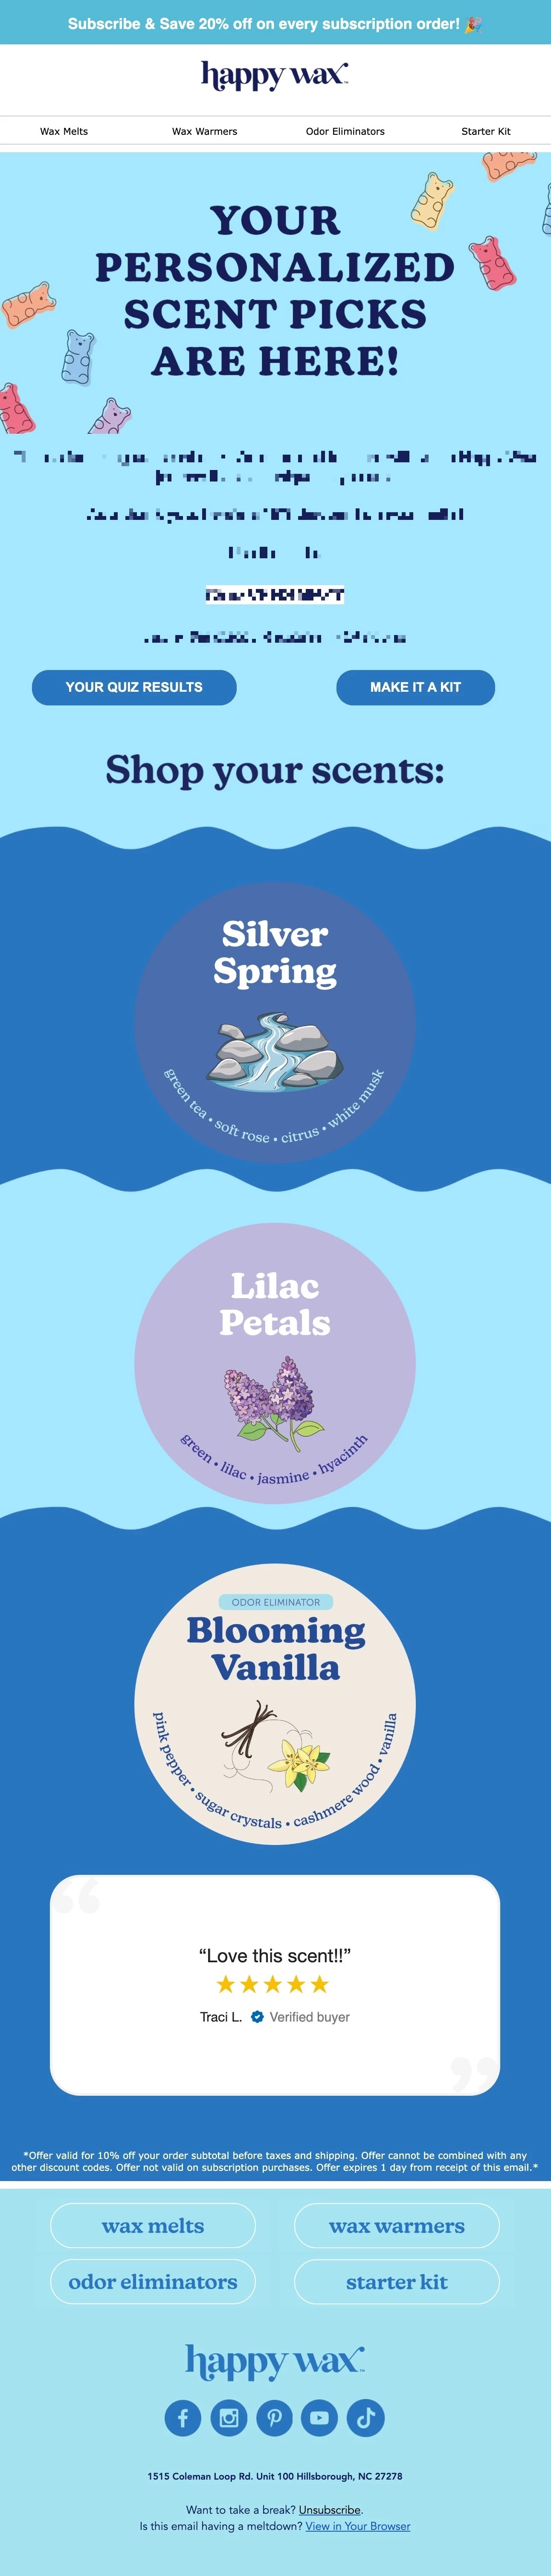
The real discovery moment came from the scent quiz. We expected it to mostly help personalize sends, but it became one of our biggest signals for product development. The responses revealed customer needs and priorities that purchase data alone never would have shown us, including opportunities we hadn't fully understood before. That's shaped how we approach product development because we're able to build around what people actually tell us they want instead of guessing based only on what they've bought.
Why doesn’t a return always mean churn?
Our Happiness Guarantee data taught us something unexpected, too. We assumed returns might mean a fragrance was weak or off-brand, but we started seeing our highest-LTV, repeat customers show up in that data just as often as anyone else. A great customer can still return a scent that isn't for them, and that's not a churn signal; it's a preference signal.
The challenge is not treating every data point as permanent or equally meaningful. Someone may purchase a scent as a gift or simply change their preferences over time. Even with a holistic profile, data still requires context. We're continuing to refine how we weigh recency, repeated behavior, and what customers explicitly tell us so the picture we build stays useful without becoming overly rigid
What Happy Wax learned: Return data does not always indicate dissatisfaction or churn. When viewed alongside purchase history, preferences, and lifetime value, it can reveal something much more specific about what an individual customer likes.
How we use segments to understand what our subscribers actually want
Bea Doheny, Senior CRM Manager at Makeup by Mario
At Makeup by Mario, Klaviyo houses all of our customer profile properties and helps us understand what experience our subscribers actually want from us. We do the classic 15% off welcome offer, early access for sales and launches, and a handful of lead gen initiatives to grow our email and sms lists. But once subscribers are in the door, it's our job to make them feel welcomed and supported with whatever they came for. We get a good amount of window shoppers online, since most customers would rather walk into their local Sephora to shop and feel the makeup in person. I never want to deter someone from doing that and our main DTC goal is the make the shoppers experience a positive one whether they are on our website for a makeup haul, they want to watch a tutorial from our artistry feed, or want to learn more about Mario's story.
I like to think of the welcome offer as the A frame signage outside a storefront, and the welcome series is the equivalent of a sales associate who greets you at the door and asks how your day's going. It starts with being friendly, then once trust is there, educate more about the products and understand more about how to solve a customer's need.
What did Makeup by Mario learn from its beauty quiz?
Quizzes are one of the best ways we collect that context.
We have a beauty quiz on our website hosted by Octane AI and integrated with Klaviyo. We ask shoppers about:
- Their skin type
- Their skin tone
- Their makeup experience level
- Where they shop
- Whether they’ve purchased at Sephora
- What type of content they want to receive from us
After a few months, a clear trend emerged: our subscribers, mostly makeup experience levels beginner to intermediate, want to learn all Mario's makeup tips and techniques. So we shifted strategy to make space for that everywhere: artistry always highlighted alongside new product launches, links to our artistry feed in every email, a 7 episode Beauty Booth email series with Sephora, and a post purchase "while you wait for your order, watch these tutorials" initiative, to name a few.
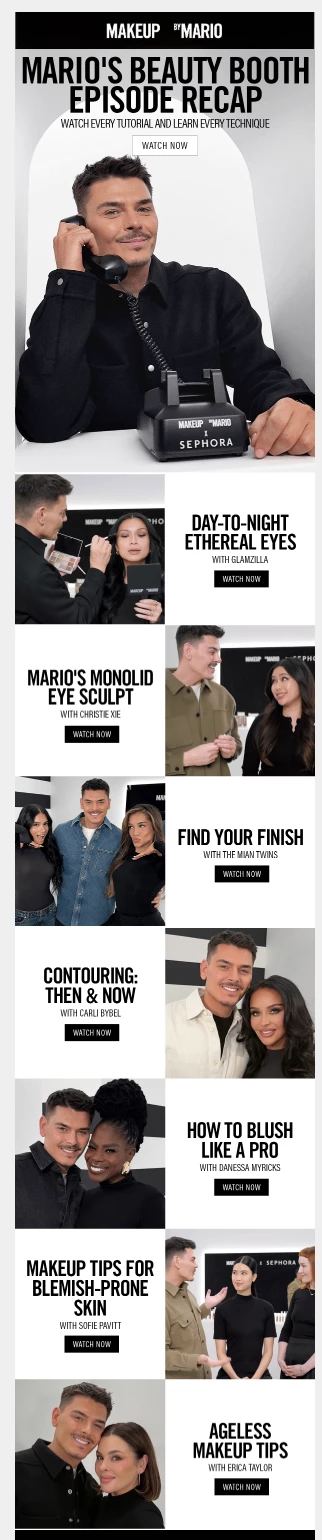
That rich data from customers, fed straight into Klaviyo properties, lets us segment and personalize a positive experience for subscribers. When we sent Mario's Beauty Booth episodes in emails, we saw a 43% lift in click rate and 32% more clicks per send compared to our evergreen product highlight emails.
At the end of the day, our DTC customers want to connect and learn something new, and we make sure Mario's artistry leads the story, with his products as the cherry on top
What Makeup by Mario learned: Quiz data should do more than determine which product appears in an email. It can reveal what kind of relationship customers want to have with the brand and influence the wider content strategy.
What flow engagement data tells us about our customers
Shannon Jörgenfelt, Sr. Manager, Email & Retention at Tatcha
At Tatcha, we treat flow engagement as a temperature check for the business, not just a report card for the flow itself. If our welcome series dips, we don't just note that it's down, we look at which metric is actually faltering. Are opens down, or are opens fine but revenue isn't following? If unsubscribes spike, we look at our list acquisition strategies to check targeting and quality. If sign-ups and opens are strong but revenue lags, that tells us it's time to reevaluate the welcome offer itself. Every data point, good or bad, is a clue into when, how, and with what message our customers actually want to be reached.
What did declining winback performance reveal?
One pattern that changed how we think: our batch-and-blast winback campaigns were getting sluggish. Open rates were below our account average, and while click rate held up, revenue per recipient was declining, a sign customers were opening out of habit but not finding a reason to buy. We moved to a flow-based winback program using Klaviyo's predicted next-purchase-date metric, so the message would fire in sync with each customer's actual buying rhythm instead of a blanket schedule. Revenue per recipient jumped 50% almost immediately. That shift proved personalization and automation worked, while allowing us to protect brand integrity by distributing promo codes more strategically.
That flow has now fully replaced our old winback program, and we've started applying the same logic elsewhere, layering in predictive signals like channel affinity across other flows to reach people more precisely instead of more often
What can engagement data not explain?
Engagement data gives us clear behavioral signals, but it can’t always tell us the motivation behind the behavior. Our winback flow shows improved re-engagement, but it doesn't tell us why someone churned in the first place. The data can only take you so far, the rest requires a human touch to brainstorm and ideate on the why
What Tatcha learned: Flow performance can reveal broader changes in customer motivation, acquisition quality, timing, and offer effectiveness. But behavioral data still needs human interpretation.
What event data shows us that campaign metrics can't
Locke Fitzpatrick, E-commerce Growth Manager at LSKD
At LSKD we use event data to track the experience, map the persona and craft the best rules of engagement in Klaviyo. The biggest learning we had in CRM with events and tracking in Klaviyo was how we can use them to map our individual relationship with a community member, then aggregate the data to find these 'common paths' that many of them follow.
Our community connects with us across a myriad of touchpoints.
We have:
- 33 retail store locations
- Two Shopify stores
- Two apps
- A loyalty program
- Hundreds of in-person events that we run ourselves or pop up at every year
Those experiences happen across Australia, New Zealand, the US, the UK, and more.
We use event tracking in Klaviyo to better understand the unique relationship a community member has with us and what that looks like. Did they first connect with us in-store or online? When did they come back for their second purchase? Do they attend local events or run clubs that we've popped up at? What are they training for? Were they at a store opening?
What did LSKD learn by tracking actual event attendance?
One example where event data revealed an interesting behaviour we weren't aware of previously was with our in-person events, we'd track great sign ups through Eventbrite and hit the same number of attendees in-person for the event itself. It wasn't until we set up in-person sign-in for the events that we realised that 50% of the attendees were no-shows from the original Eventbrite list, the in-person event was packed with new community that had come with a friend or someone they knew that did sign up.
How did LSKD act on that insight?
From this insight we sent out an exclusive invite to the event no-shows to their local LSKD store's next VIP night, "We missed you last weekend at X event, come in-store for VIP night, we'd love to see you." This is an example where there was an immediate action to take off the insights from the data, this isn't always the case. Although not every event based data insight will have a ready-to-go campaign send or flow to build off the back of it, if set up correctly, they will always give you valuable context into who your community is and how they engage with you.
How can marketers use Klaviyo data to understand customers better?
None of these four brands added more data to get here. They just started asking different questions of the data they already had. Rachel found preference signals hiding inside return data. Bea found an untapped appetite for education inside a quiz she almost treated as a personalization gimmick. Shannon found apathy where she expected loyalty. Locke found that an Eventbrite list was only telling half the story about who actually showed up.
The pattern across all four: the surprising moment came when someone looked past the metric that was supposed to explain things and asked what it actually meant
Instead of only asking whether a metric increased or decreased, try asking:
- What assumption are we making about this behavior?
- Is there another way to interpret it?
- What context might be missing?
- Is this a one-time action or a repeated pattern?
- What has the customer explicitly told us?
- What can we act on immediately?
- What does the data still fail to explain?
Frequently asked questions about Klaviyo customer data
How can Klaviyo help brands understand their customers?
Klaviyo can bring together profile properties, purchase history, engagement behavior, quiz responses, survey data, predictive analytics, and custom events. Looking at these signals together can help brands understand customer preferences, intent, timing, and patterns of engagement.
What is the difference between a profile property and an event?
A profile property describes something about a customer, such as a preference, skin type, experience level, or loyalty status.
An event records that an action occurred, such as placing an order, returning a product, attending an event, or visiting a store.
Properties provide context about who someone is. Events provide context about what they did.
How can quiz data be used in Klaviyo?
Quiz responses can be stored as Klaviyo profile properties and used to personalize content, create customer segments, recommend products, develop educational campaigns, and identify broader trends across an audience.
As Happy Wax and Makeup by Mario found, quiz data can also influence product development and content strategy.
Can flow metrics reveal problems outside the flow?
Yes. A drop in flow performance may point to a problem with audience quality, acquisition strategy, offer strength, timing, or customer motivation—not necessarily the flow content itself.
Why should brands track offline events in Klaviyo?
Offline event tracking can help brands connect registrations, attendance, store visits, community participation, and later purchases to an individual customer profile.
It may also reveal that the people who register for an experience are not necessarily the same people who attend it.
Ask your data a different question
What has your data told you that you didn’t expect?
Maybe it was a segment that moved in a direction you couldn’t explain, a flow that underperformed for a reason you didn’t see coming, or a property that changed how you think about an entire portion of your list.
Tell us about it in the comments.