

Contributor I
September 5, 2022
Solved

API vs Dashboard Data Reporting

  • September 5, 2022
  • 2 replies
  • 513 views

Hey, i am trying to figure out if we can pull daily data so it will be unique per month.
As i saw you show monthly data in the dashboard. But when pulling via api with unit=month its still not the same number.

Is there a way to see daily data(unit=day) so it will be unique for the whole month?

    This topic has been closed for replies.
    Best answer by Dov

    Hi @Become,

    Thanks for sharing this question with us.

    Using the Metrics API you can select a start/end date for a metric export as well as a “unit” to bucket data into one of day, week or month.

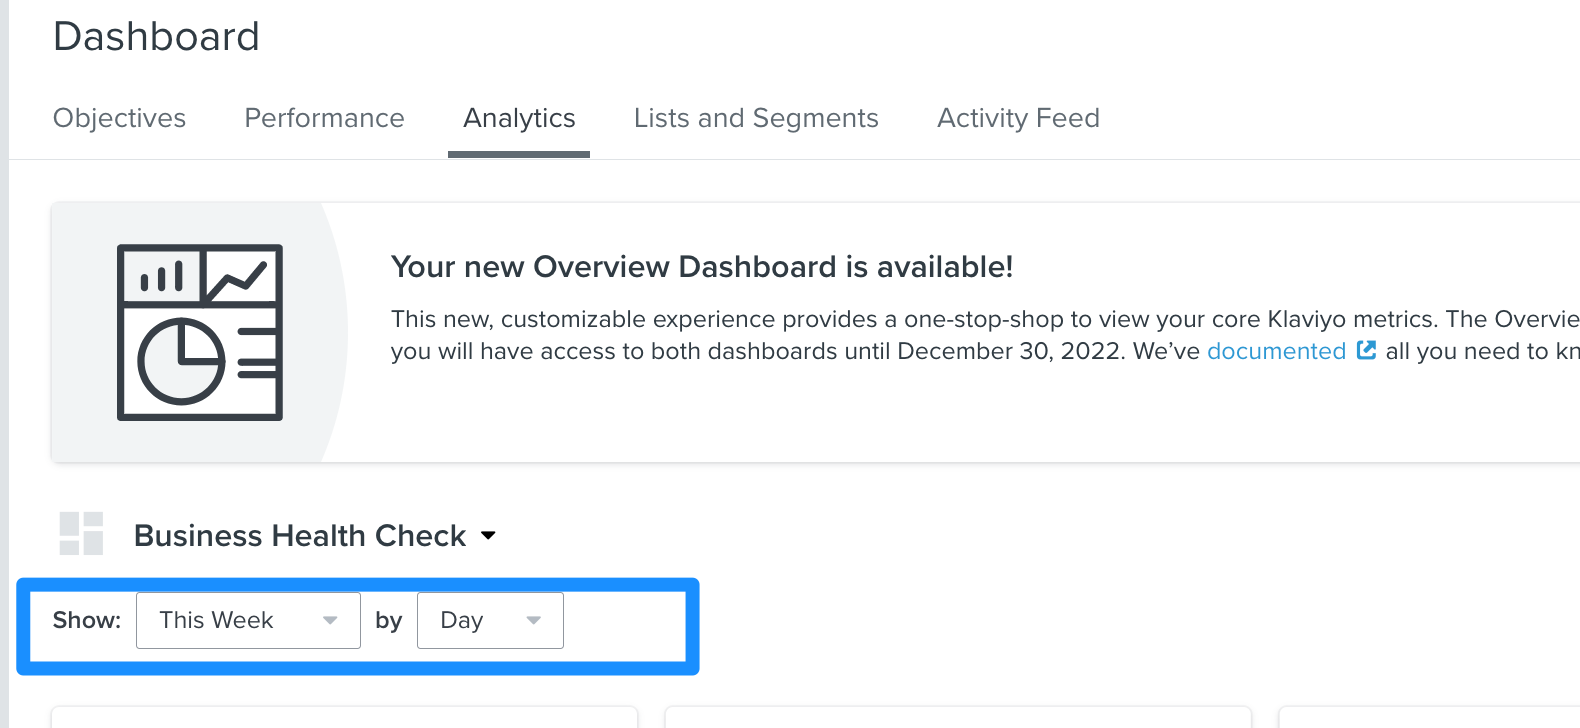
    Also, within the dashboard itself, you can adjust the timeframe to break down the data “by day”, if you wish.

    In terms of the discrepancies, you can read more about this and which reports use message attribution and which ones do not, here.

    I hope that’s helpful.

    2 replies

    Dov
    DovAnswer
    Klaviyo Alum
    September 6, 2022

    Hi @Become,

    Thanks for sharing this question with us.

    Using the Metrics API you can select a start/end date for a metric export as well as a “unit” to bucket data into one of day, week or month.

    Also, within the dashboard itself, you can adjust the timeframe to break down the data “by day”, if you wish.

    In terms of the discrepancies, you can read more about this and which reports use message attribution and which ones do not, here.

    I hope that’s helpful.

    DD
    Contributor I
    September 9, 2022

    I’ve wrestled with this issue for quite some time. The only method I was able to find when looking for overall flow and campaign revenue, is to use the query metrics api with the the ‘by’  parameter set to ‘$attributed_message’. This gives the attributed revenue by day for each message for both flows and campaigns, which then must be aggregated.