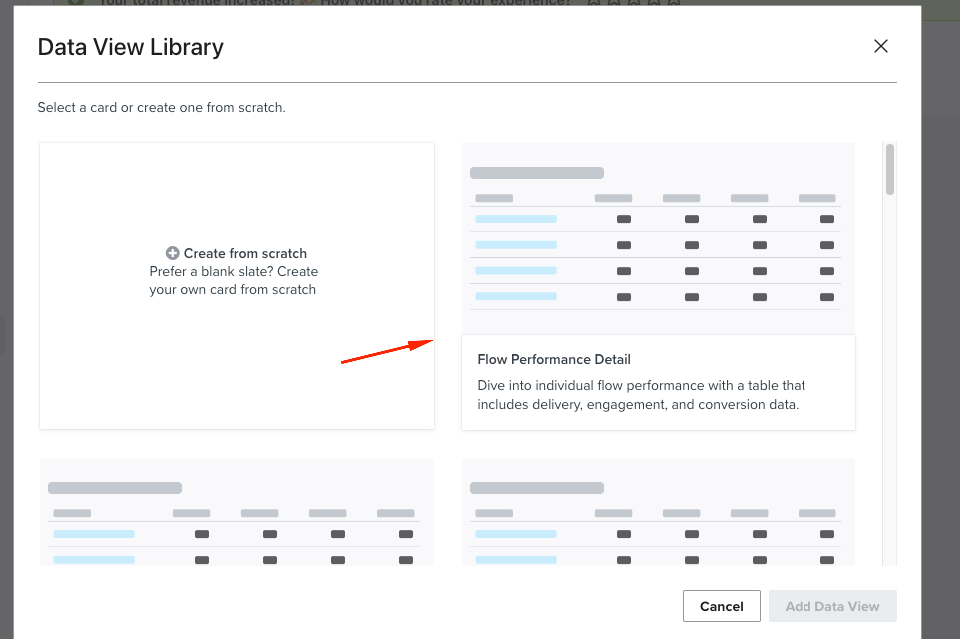
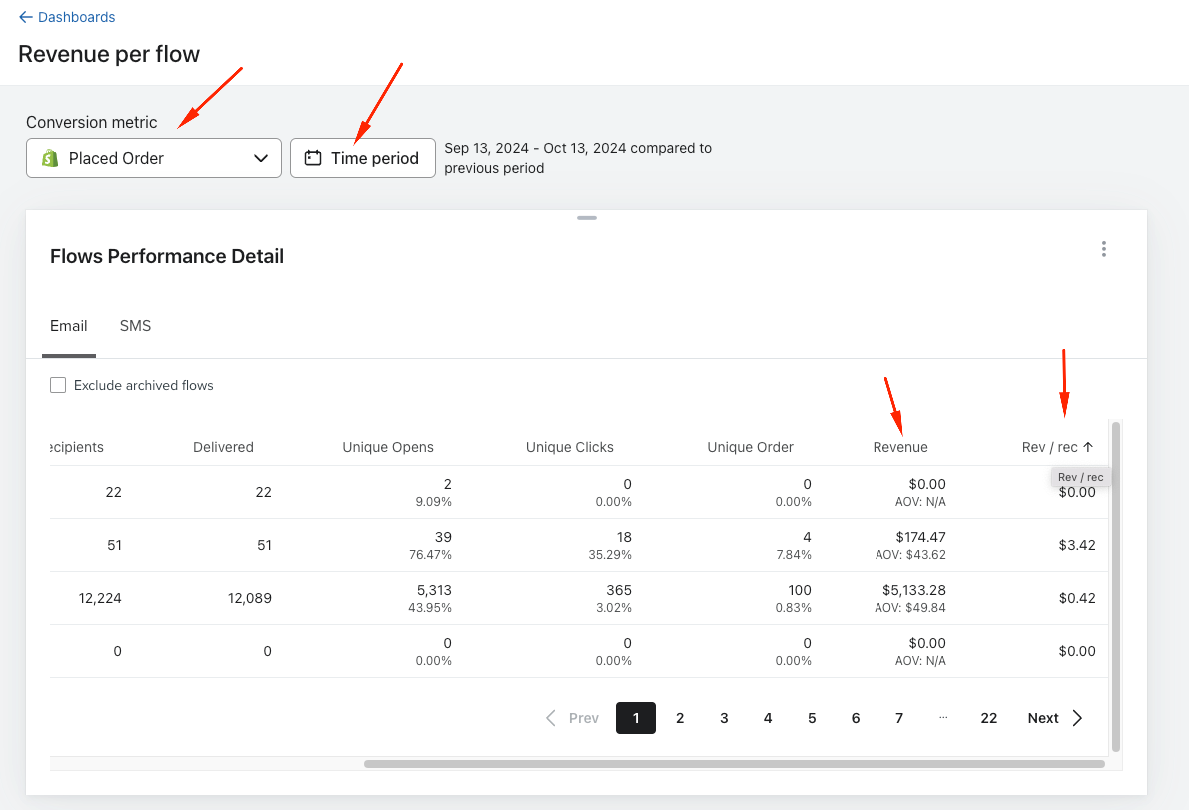
Hey @Busra Sahin - You can view revenue per recipient for each flow by creating a Klaviyo dashboard data view, then setting the Conversion metric and date range. Go to Dashboards, create a new dashboard, click Add data view, and adjust the Conversion metric plus the time period. The resulting data view will display revenue per recipient broken out by flow.
Here is the step-by-step:
In Klaviyo, open Dashboards.
Create a new dashboard and give it a clear name.
Click Add data view to insert a new visualization.
In the data view settings, change the Conversion metric as needed and set your desired time period/date range.
Review the results: the data view will show revenue per recipient for each flow.
Optional: You can also pursue a custom report workflow outside Klaviyo (e.g., export and calculate Total Revenue ÷ Total Recipients per flow), but the dashboard method above is the fastest.
Hey @Busra Sahin - You can view revenue per recipient for each flow by creating a Klaviyo dashboard data view, then setting the Conversion metric and date range. Go to Dashboards, create a new dashboard, click Add data view, and adjust the Conversion metric plus the time period. The resulting data view will display revenue per recipient broken out by flow.
Here is the step-by-step:
In Klaviyo, open Dashboards.
Create a new dashboard and give it a clear name.
Click Add data view to insert a new visualization.
In the data view settings, change the Conversion metric as needed and set your desired time period/date range.
Review the results: the data view will show revenue per recipient for each flow.
Optional: You can also pursue a custom report workflow outside Klaviyo (e.g., export and calculate Total Revenue ÷ Total Recipients per flow), but the dashboard method above is the fastest.
Identify Data Sources: Determine where your data is stored. This could be in your marketing platform (like Klaviyo, Mailchimp, etc.), your eCommerce platform, or a database.
Export Data: Export the following data:
Revenue Data: Total revenue generated from each flow over a specific period.
Recipient Data: List of recipients who received messages from each flow.
Step 2: Prepare Your Data
Data Cleaning: Import your data into a spreadsheet (like Excel or Google Sheets) and clean it by removing duplicates, ensuring all relevant columns are present, and standardizing formats.
Organize Data: Create separate sheets for revenue and recipient data if necessary. Make sure each sheet includes a unique identifier for the flows (like flow name or ID).
Step 3: Calculate Revenue per Recipient
Combine Data: Merge the revenue and recipient data based on the flow identifier. You can use functions like VLOOKUP or JOIN in SQL if you're using a database.
Create Calculation: In your spreadsheet, add a new column for "Revenue per Recipient":
Formula: Revenue per Recipient = Total Revenue from Flow / Total Recipients for Flow.
Step 4: Build the Report
Visualize Results: Use charts and graphs to visualize the data:
Bar Chart: Display revenue per recipient for each flow.
Table: List total revenue, total recipients, and revenue per recipient for quick reference.
Filter Options: Add filters for date ranges, specific flows, or segments of your audience to facilitate analysis.
Step 5: Automate Reporting (Optional)
Use Reporting Tools: If your platform allows, set up automated reporting features to run these calculations at specified intervals.
Dashboards: Consider creating a dashboard that pulls data in real-time to keep track of key metrics.
Step 6: Analyze and Optimize
Review Insights: Look for patterns in the data to understand which flows are most effective.
Adjust Strategies: Use your findings to refine your marketing strategies, focusing on flows that yield higher revenue per recipient.
Additional Tools
BI Tools: Consider using tools like Tableau, Power BI, or Google Data Studio for more advanced visualizations and real-time data analysis.
APIs: If you’re comfortable with coding, consider using APIs to pull data directly from your platforms for more dynamic reporting.